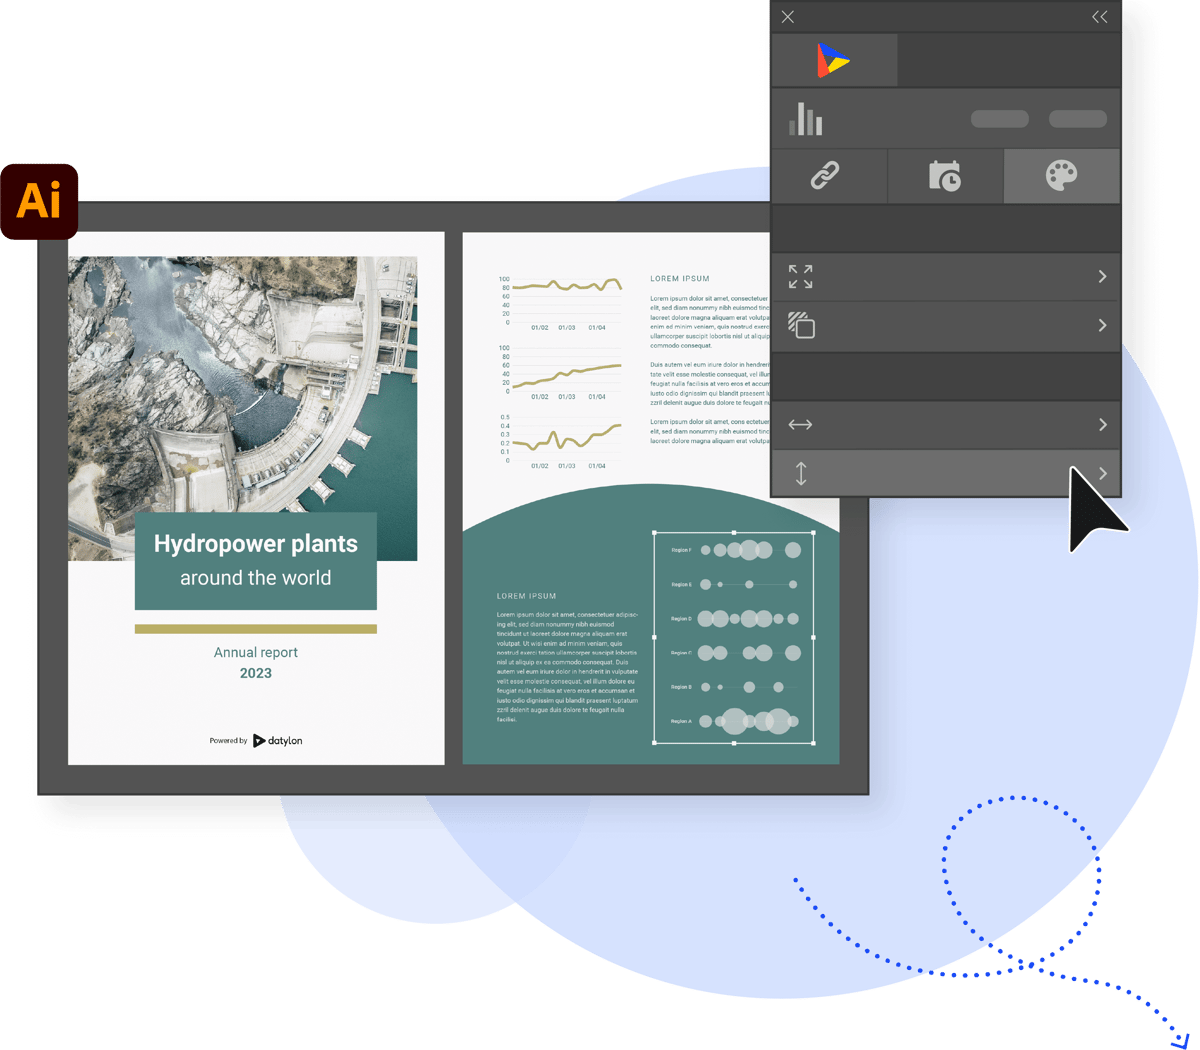
Design captivating reusable reports
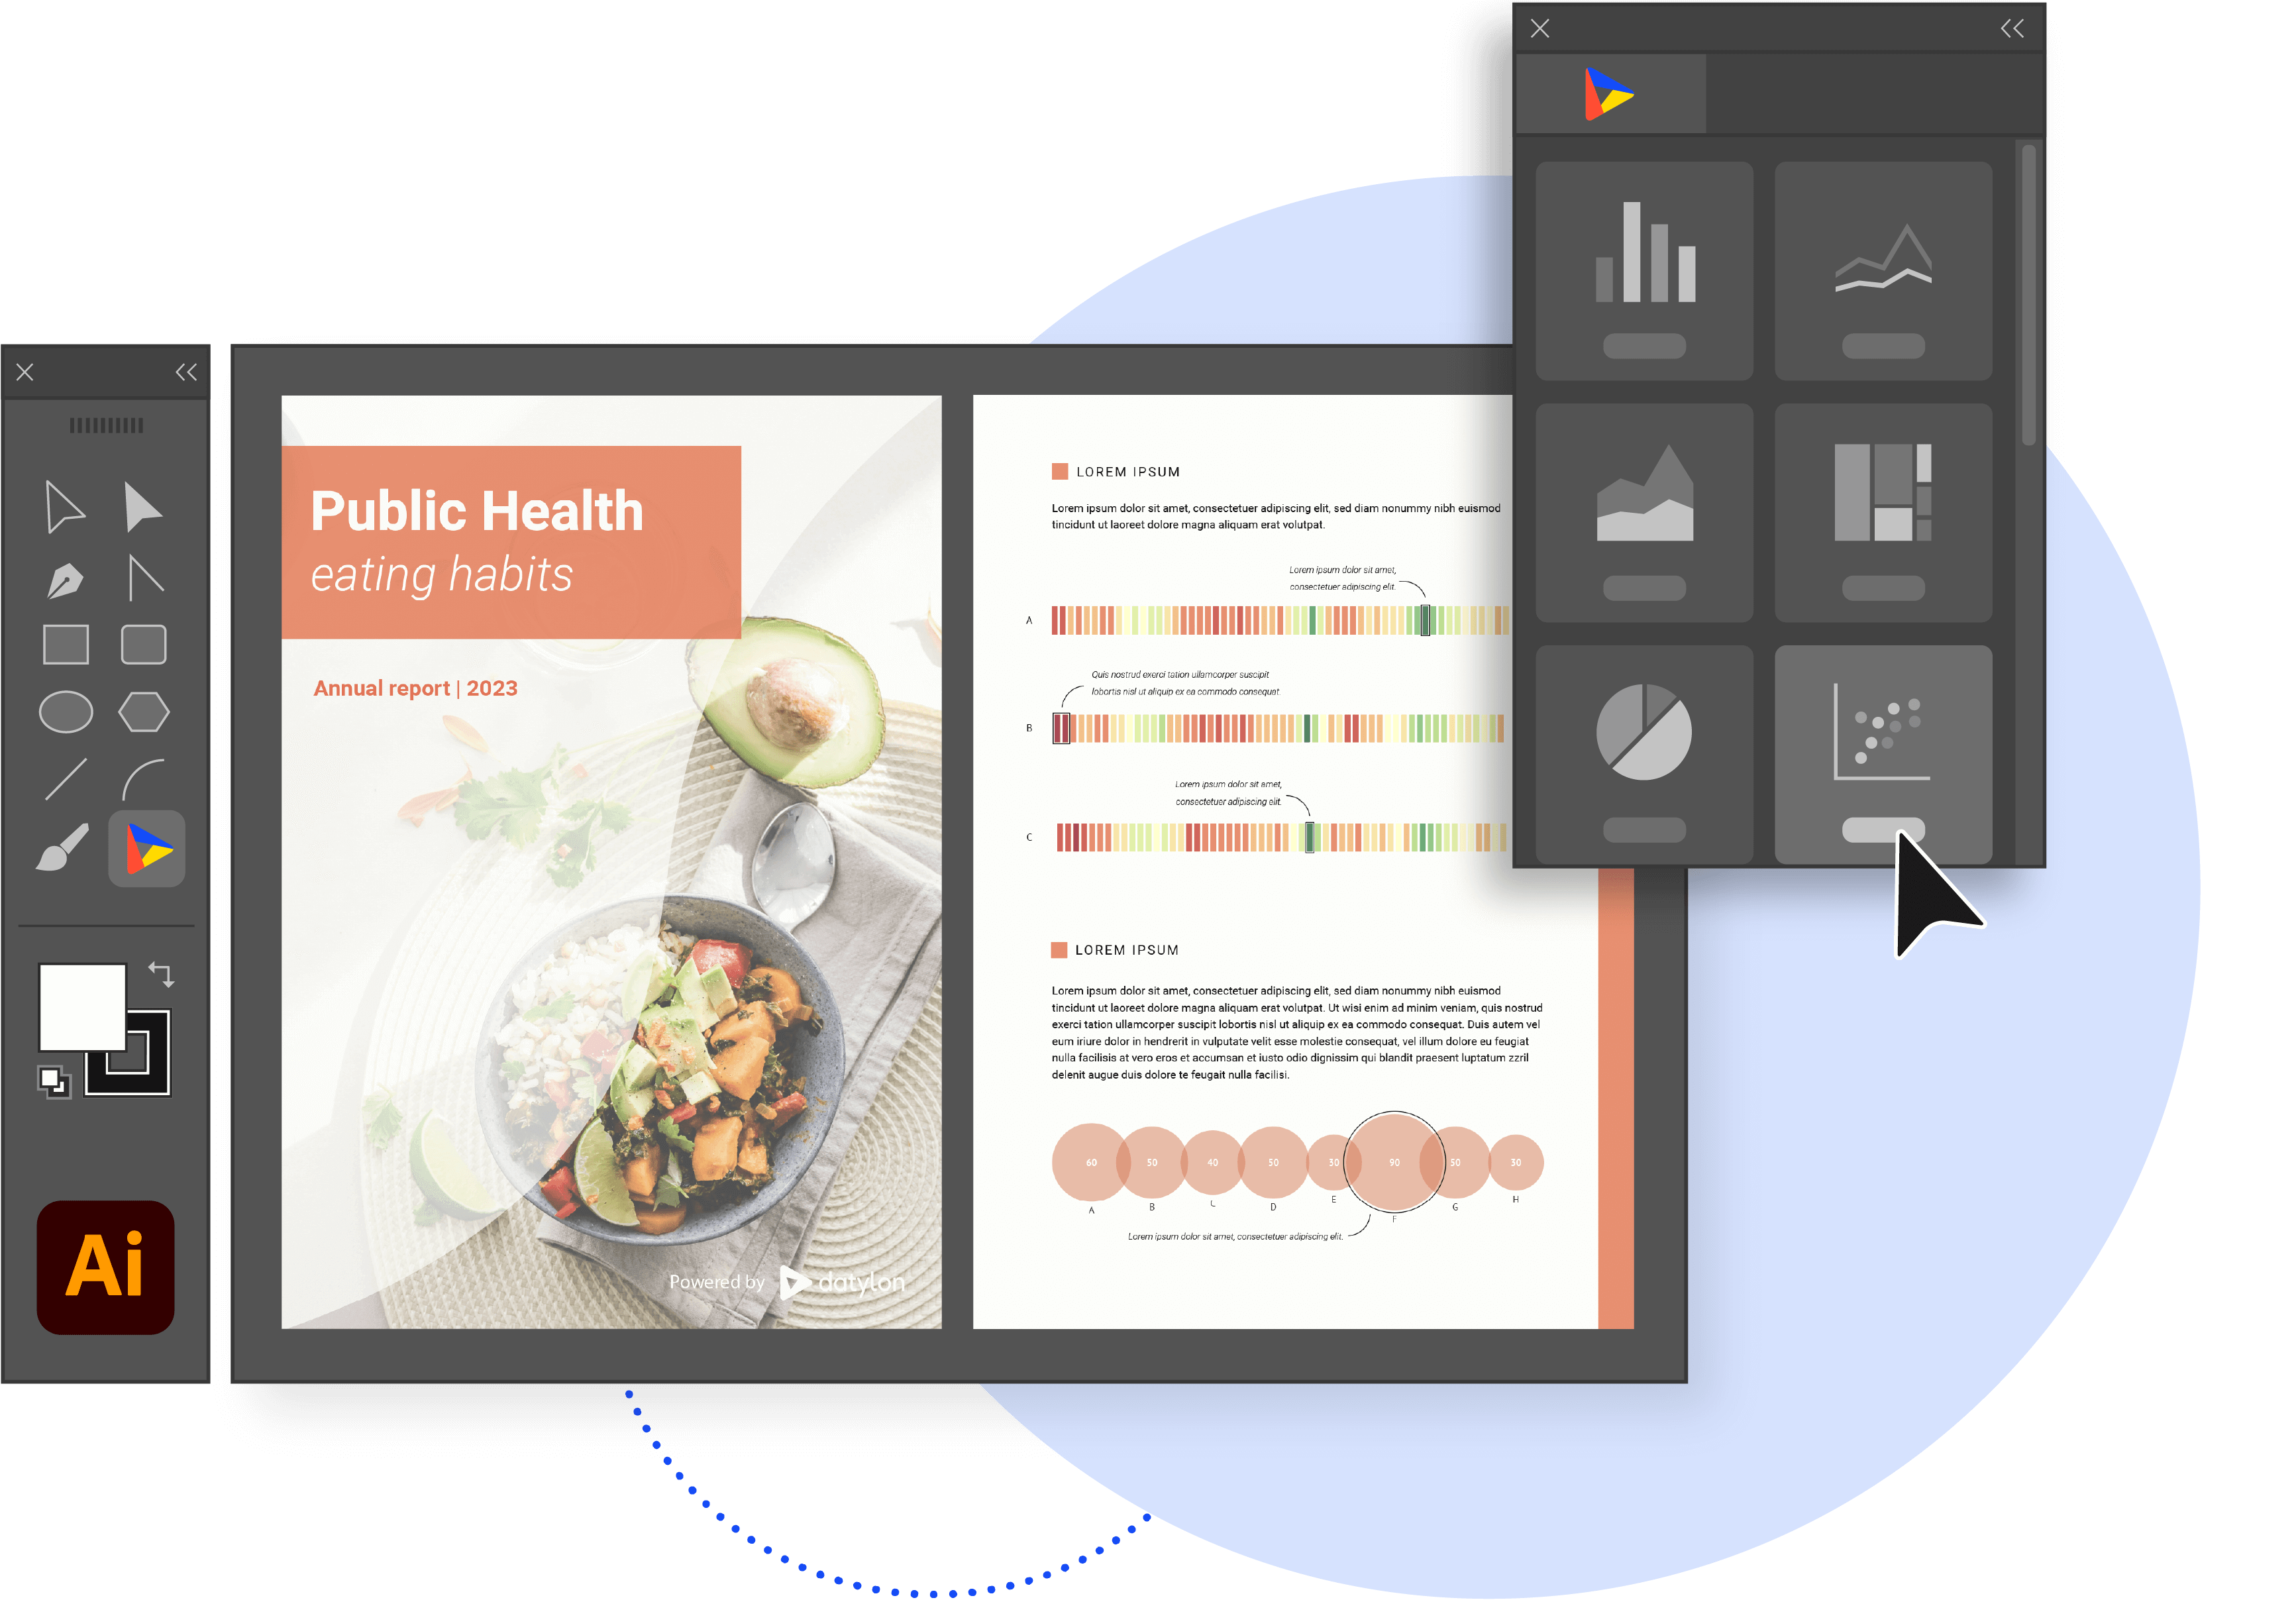
Use Datylon for Illustrator for your data-rich report design. Enhance your reports, dashboards or infographics with beautiful, pixel-perfect charts. Create on-brand templates for others to reuse.
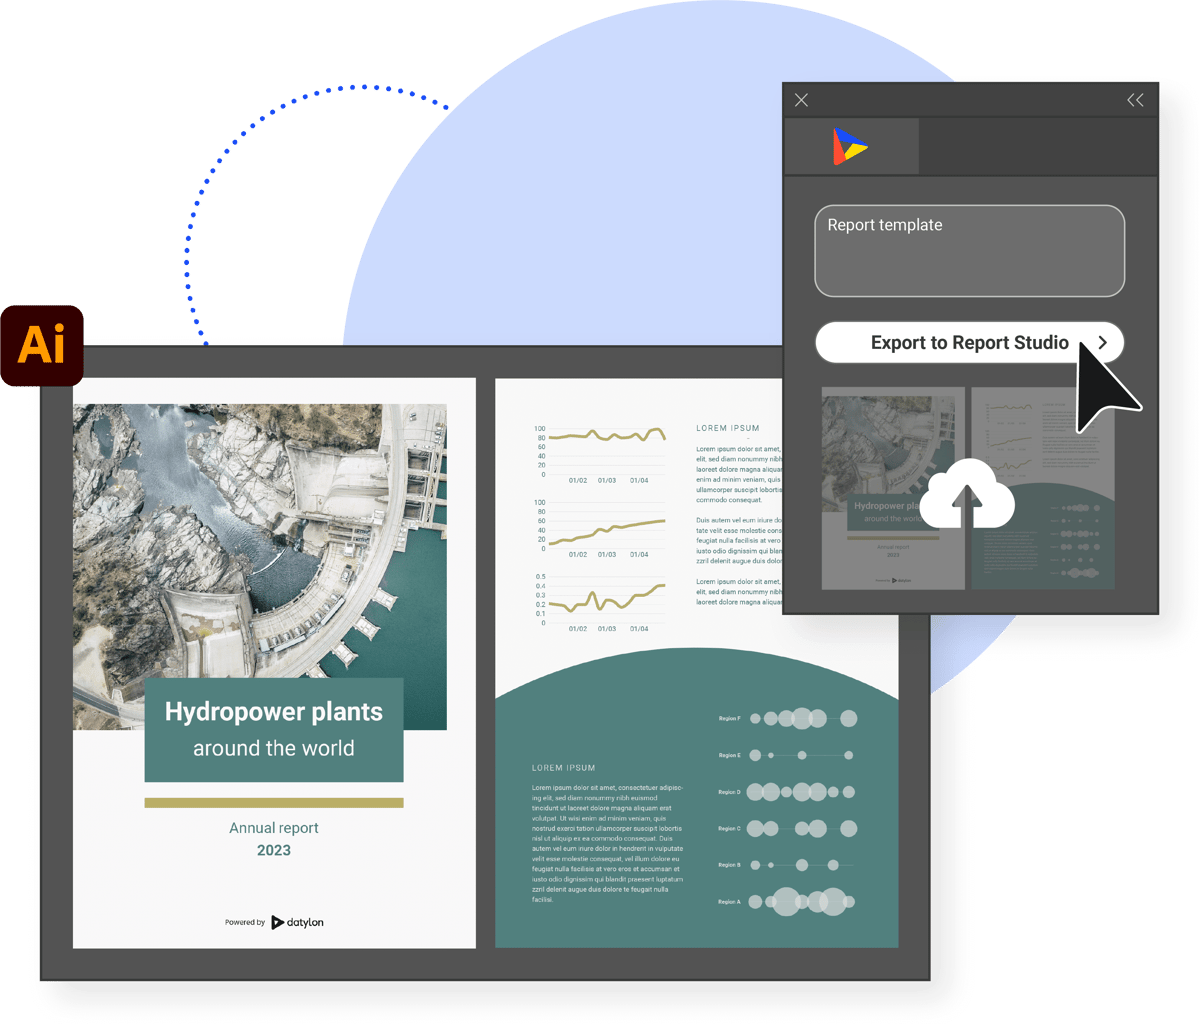
Publish reports with ease
Either export report designs directly from Illustrator, place them in Adobe InDesign layouts or upload them as templates to Datylon Report Studio for others to edit data and produce periodic reports.
No code, no problem
Report design is a craft, and report designers are artists. So we eliminated the barrier of coding, enabling designers to focus solely on crafting compelling narratives and creating visually stunning data stories.
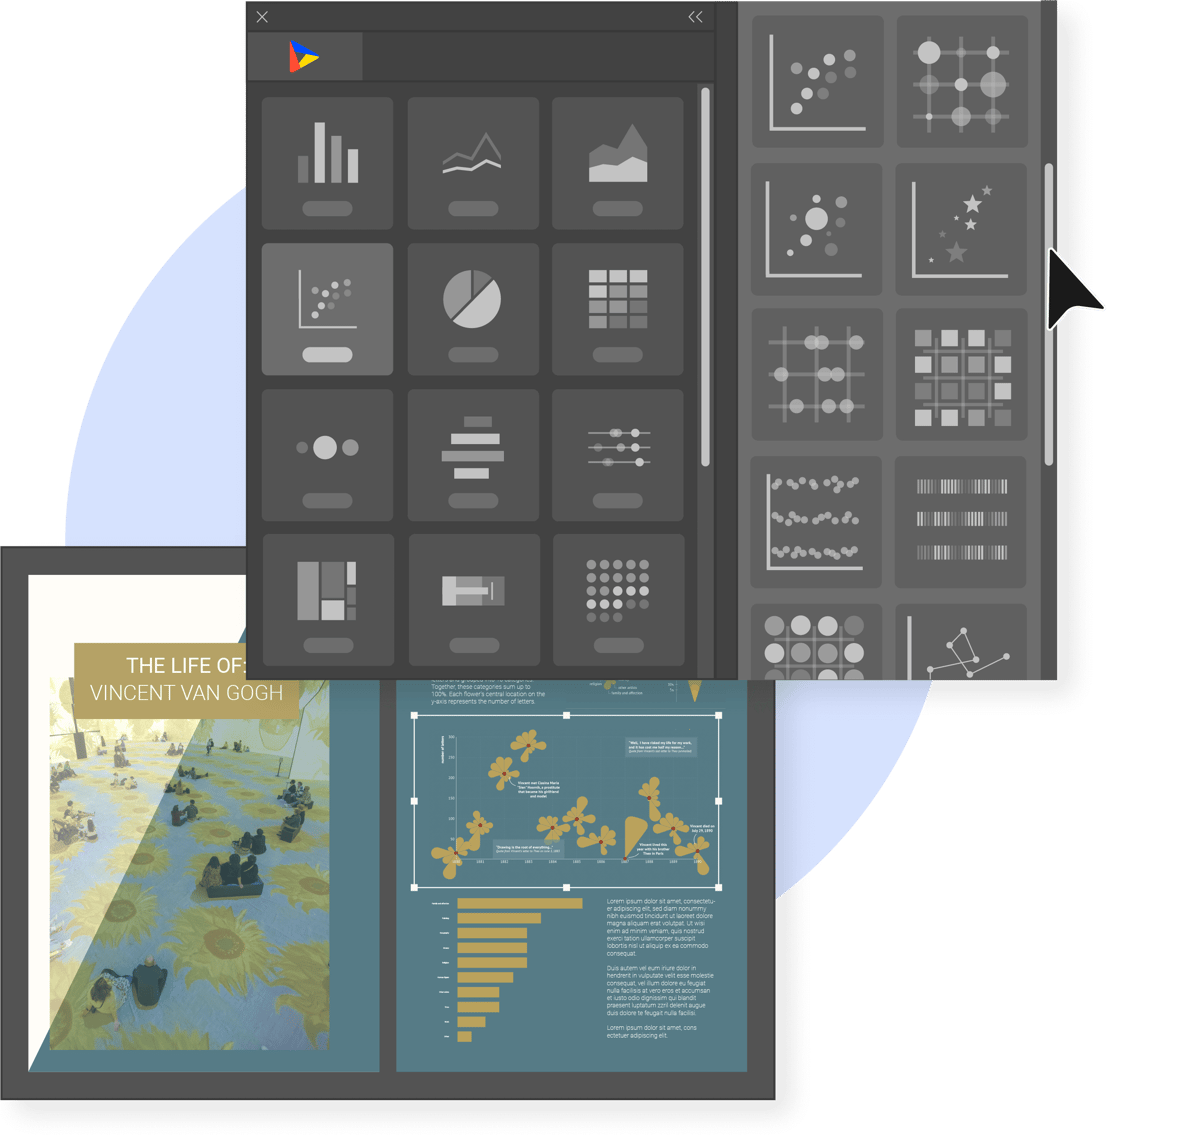
Save time with customizable charts
Diversify your report with a collection of beautiful data visualizations. Select from 130+ chart templates that are ready to be stylized. Merge charts together into exciting visuals. Build your own custom library of on-brand charts for reuse. Without coding.
Get started now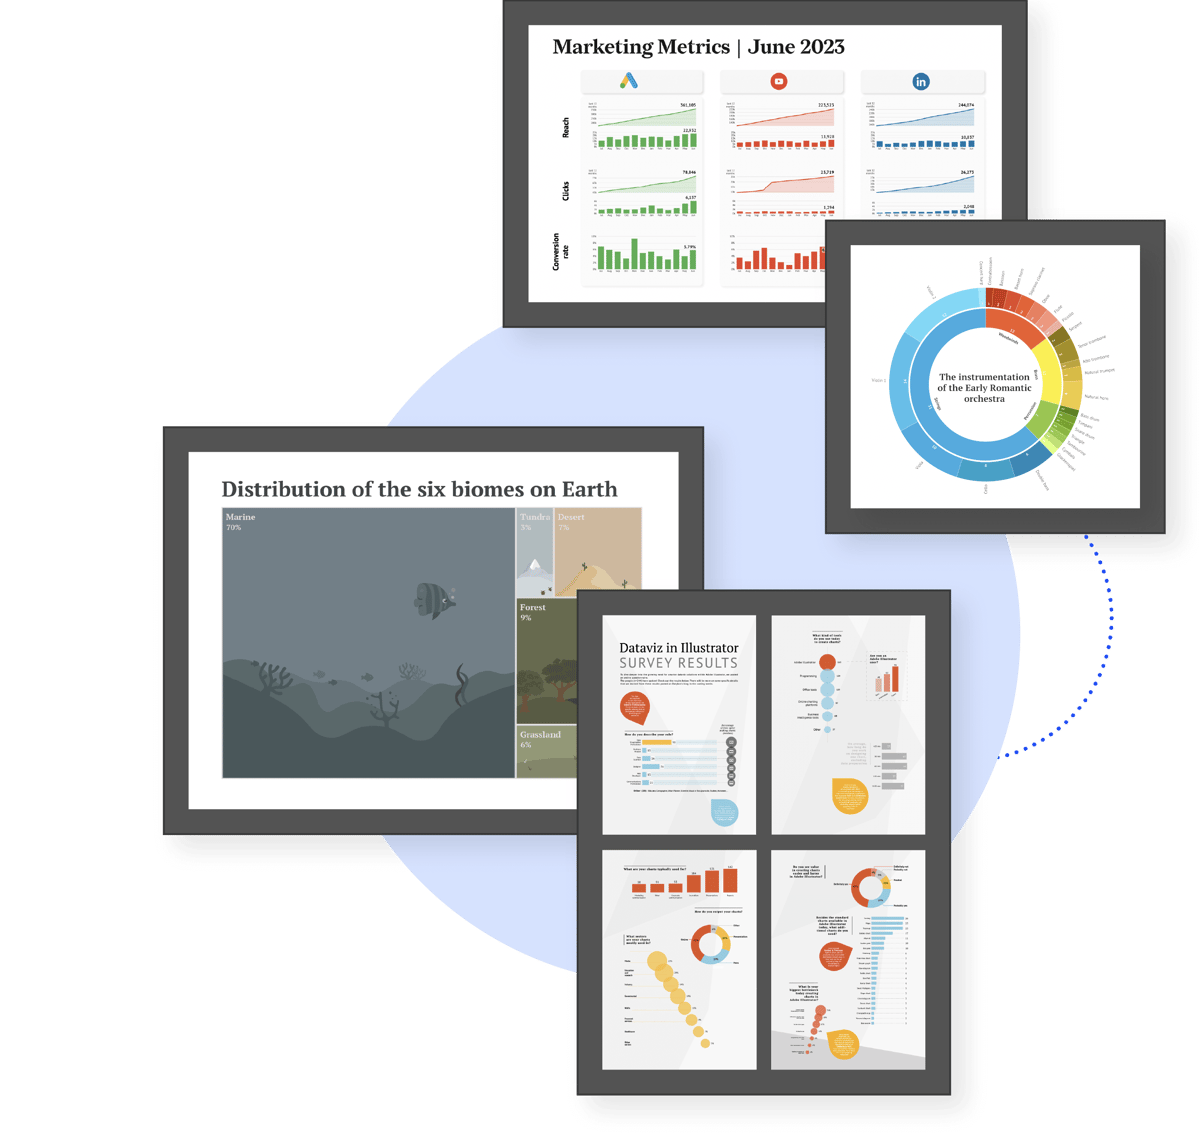
Widest range of applications
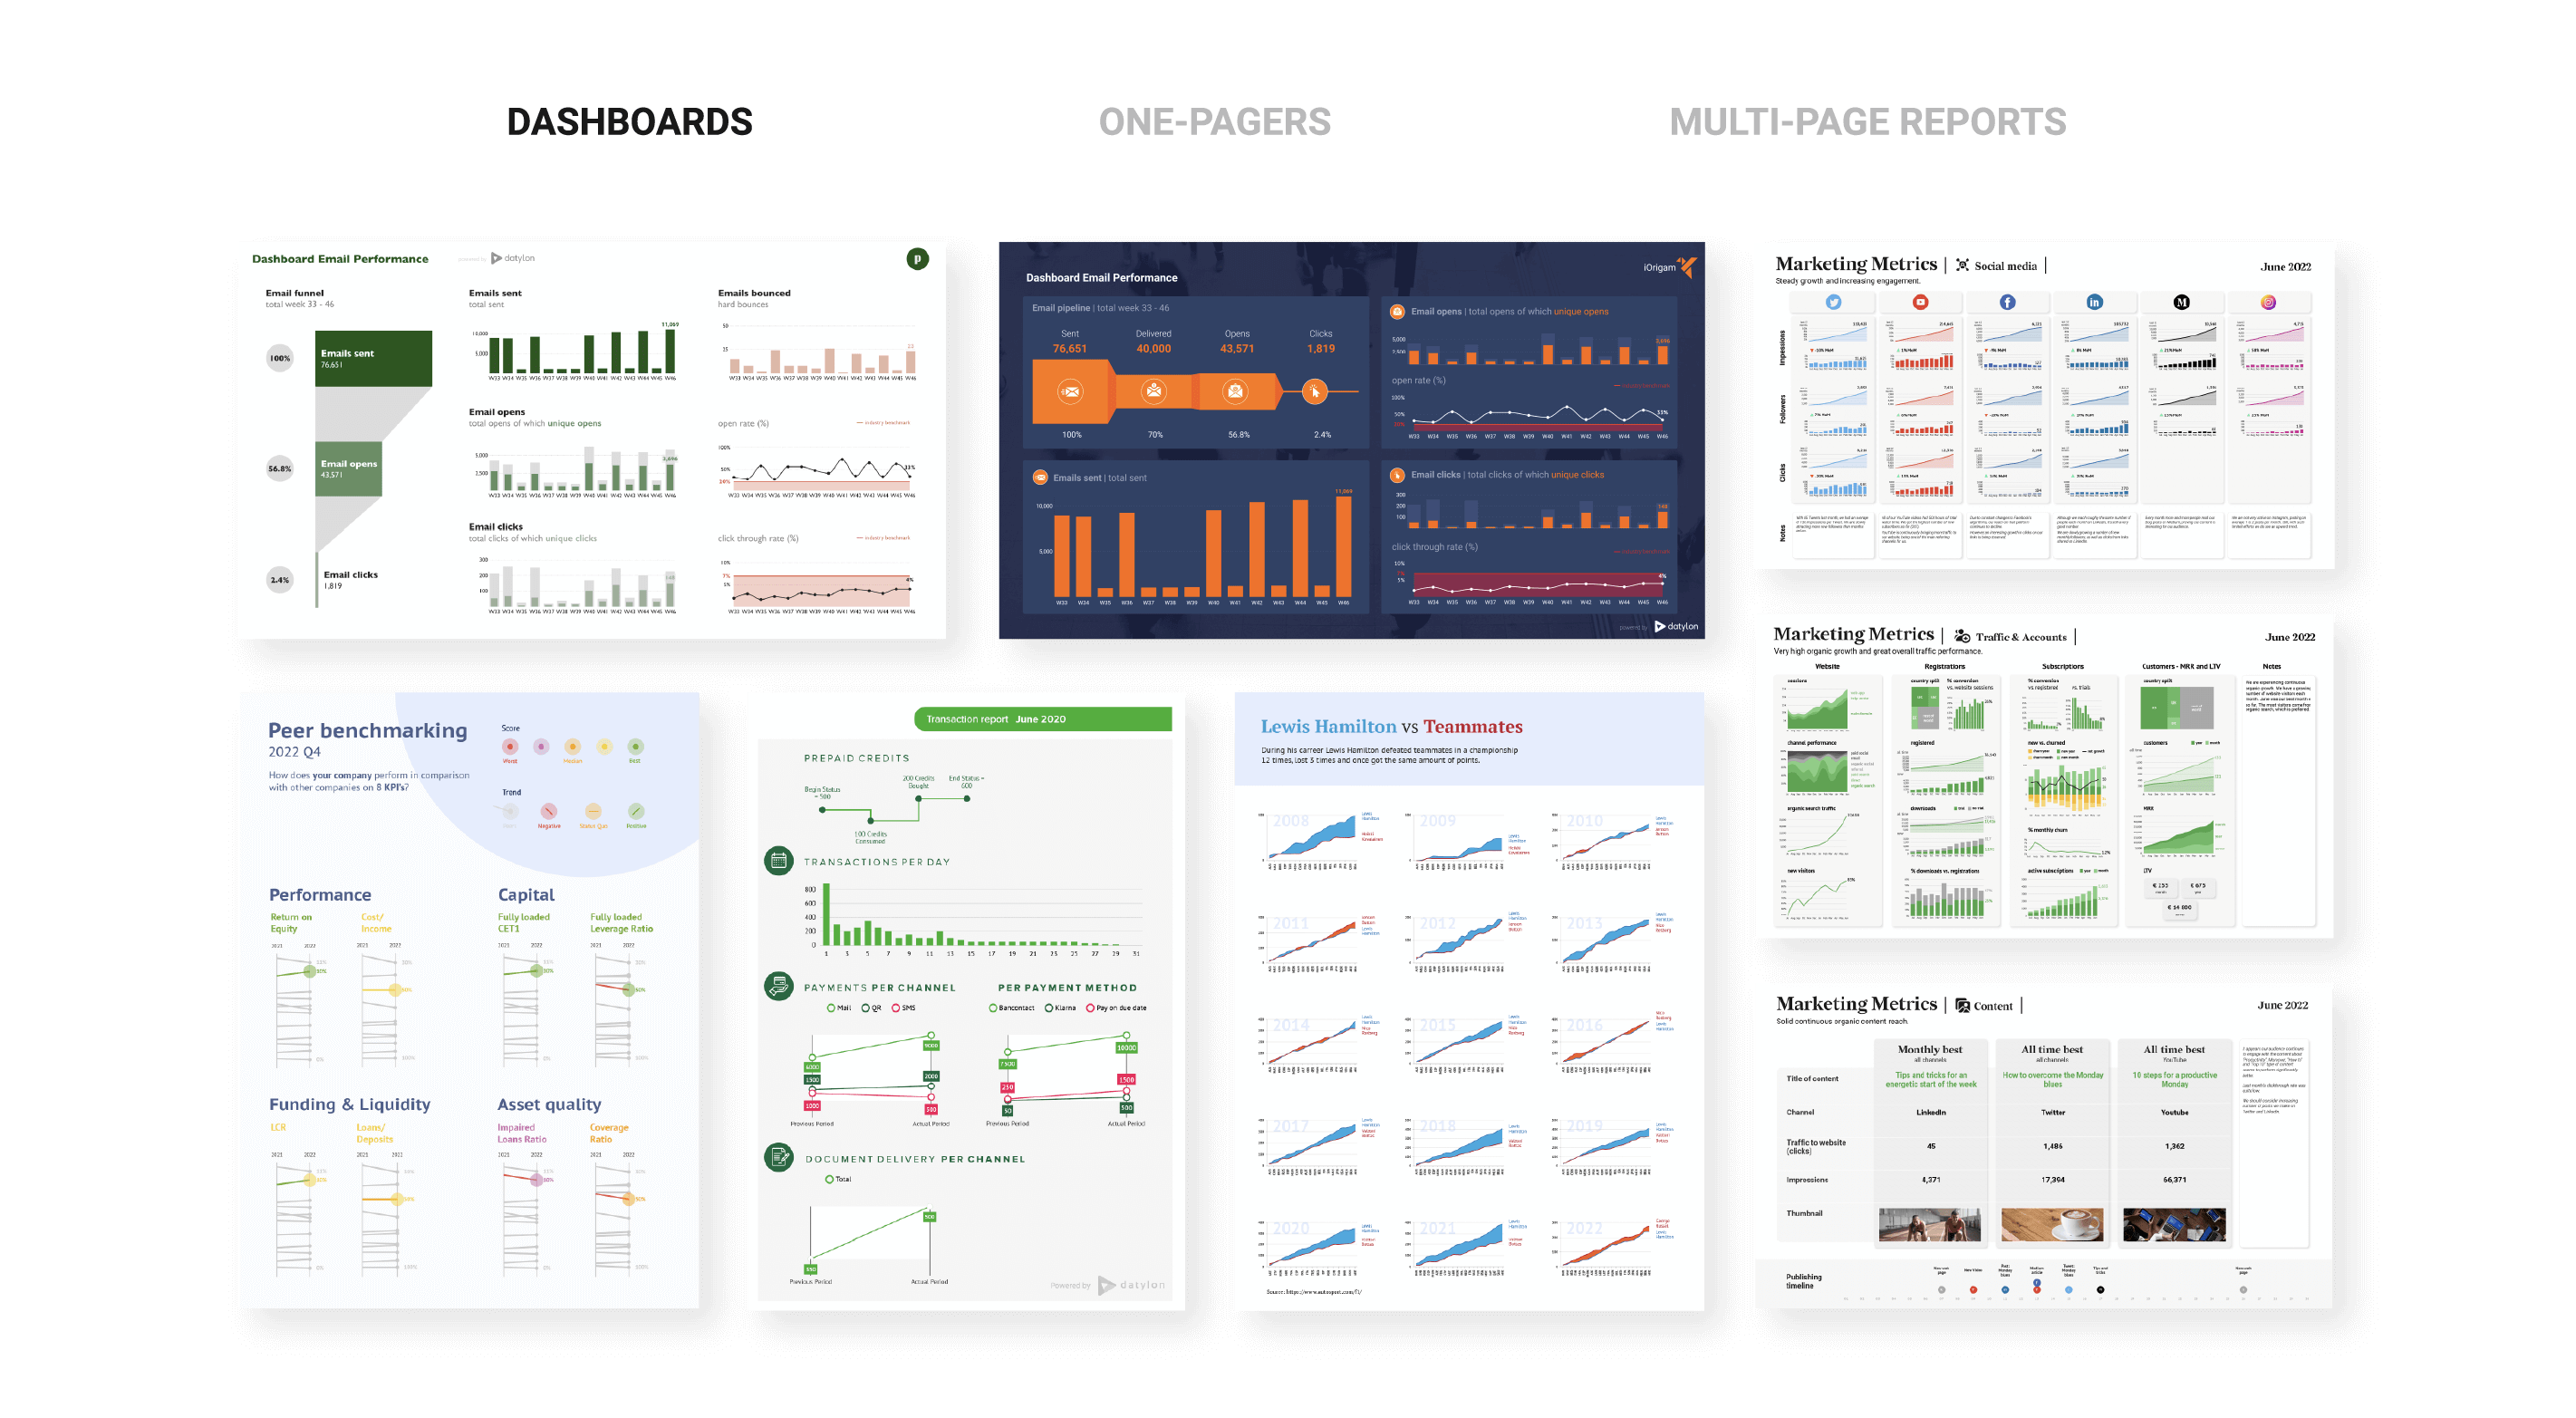
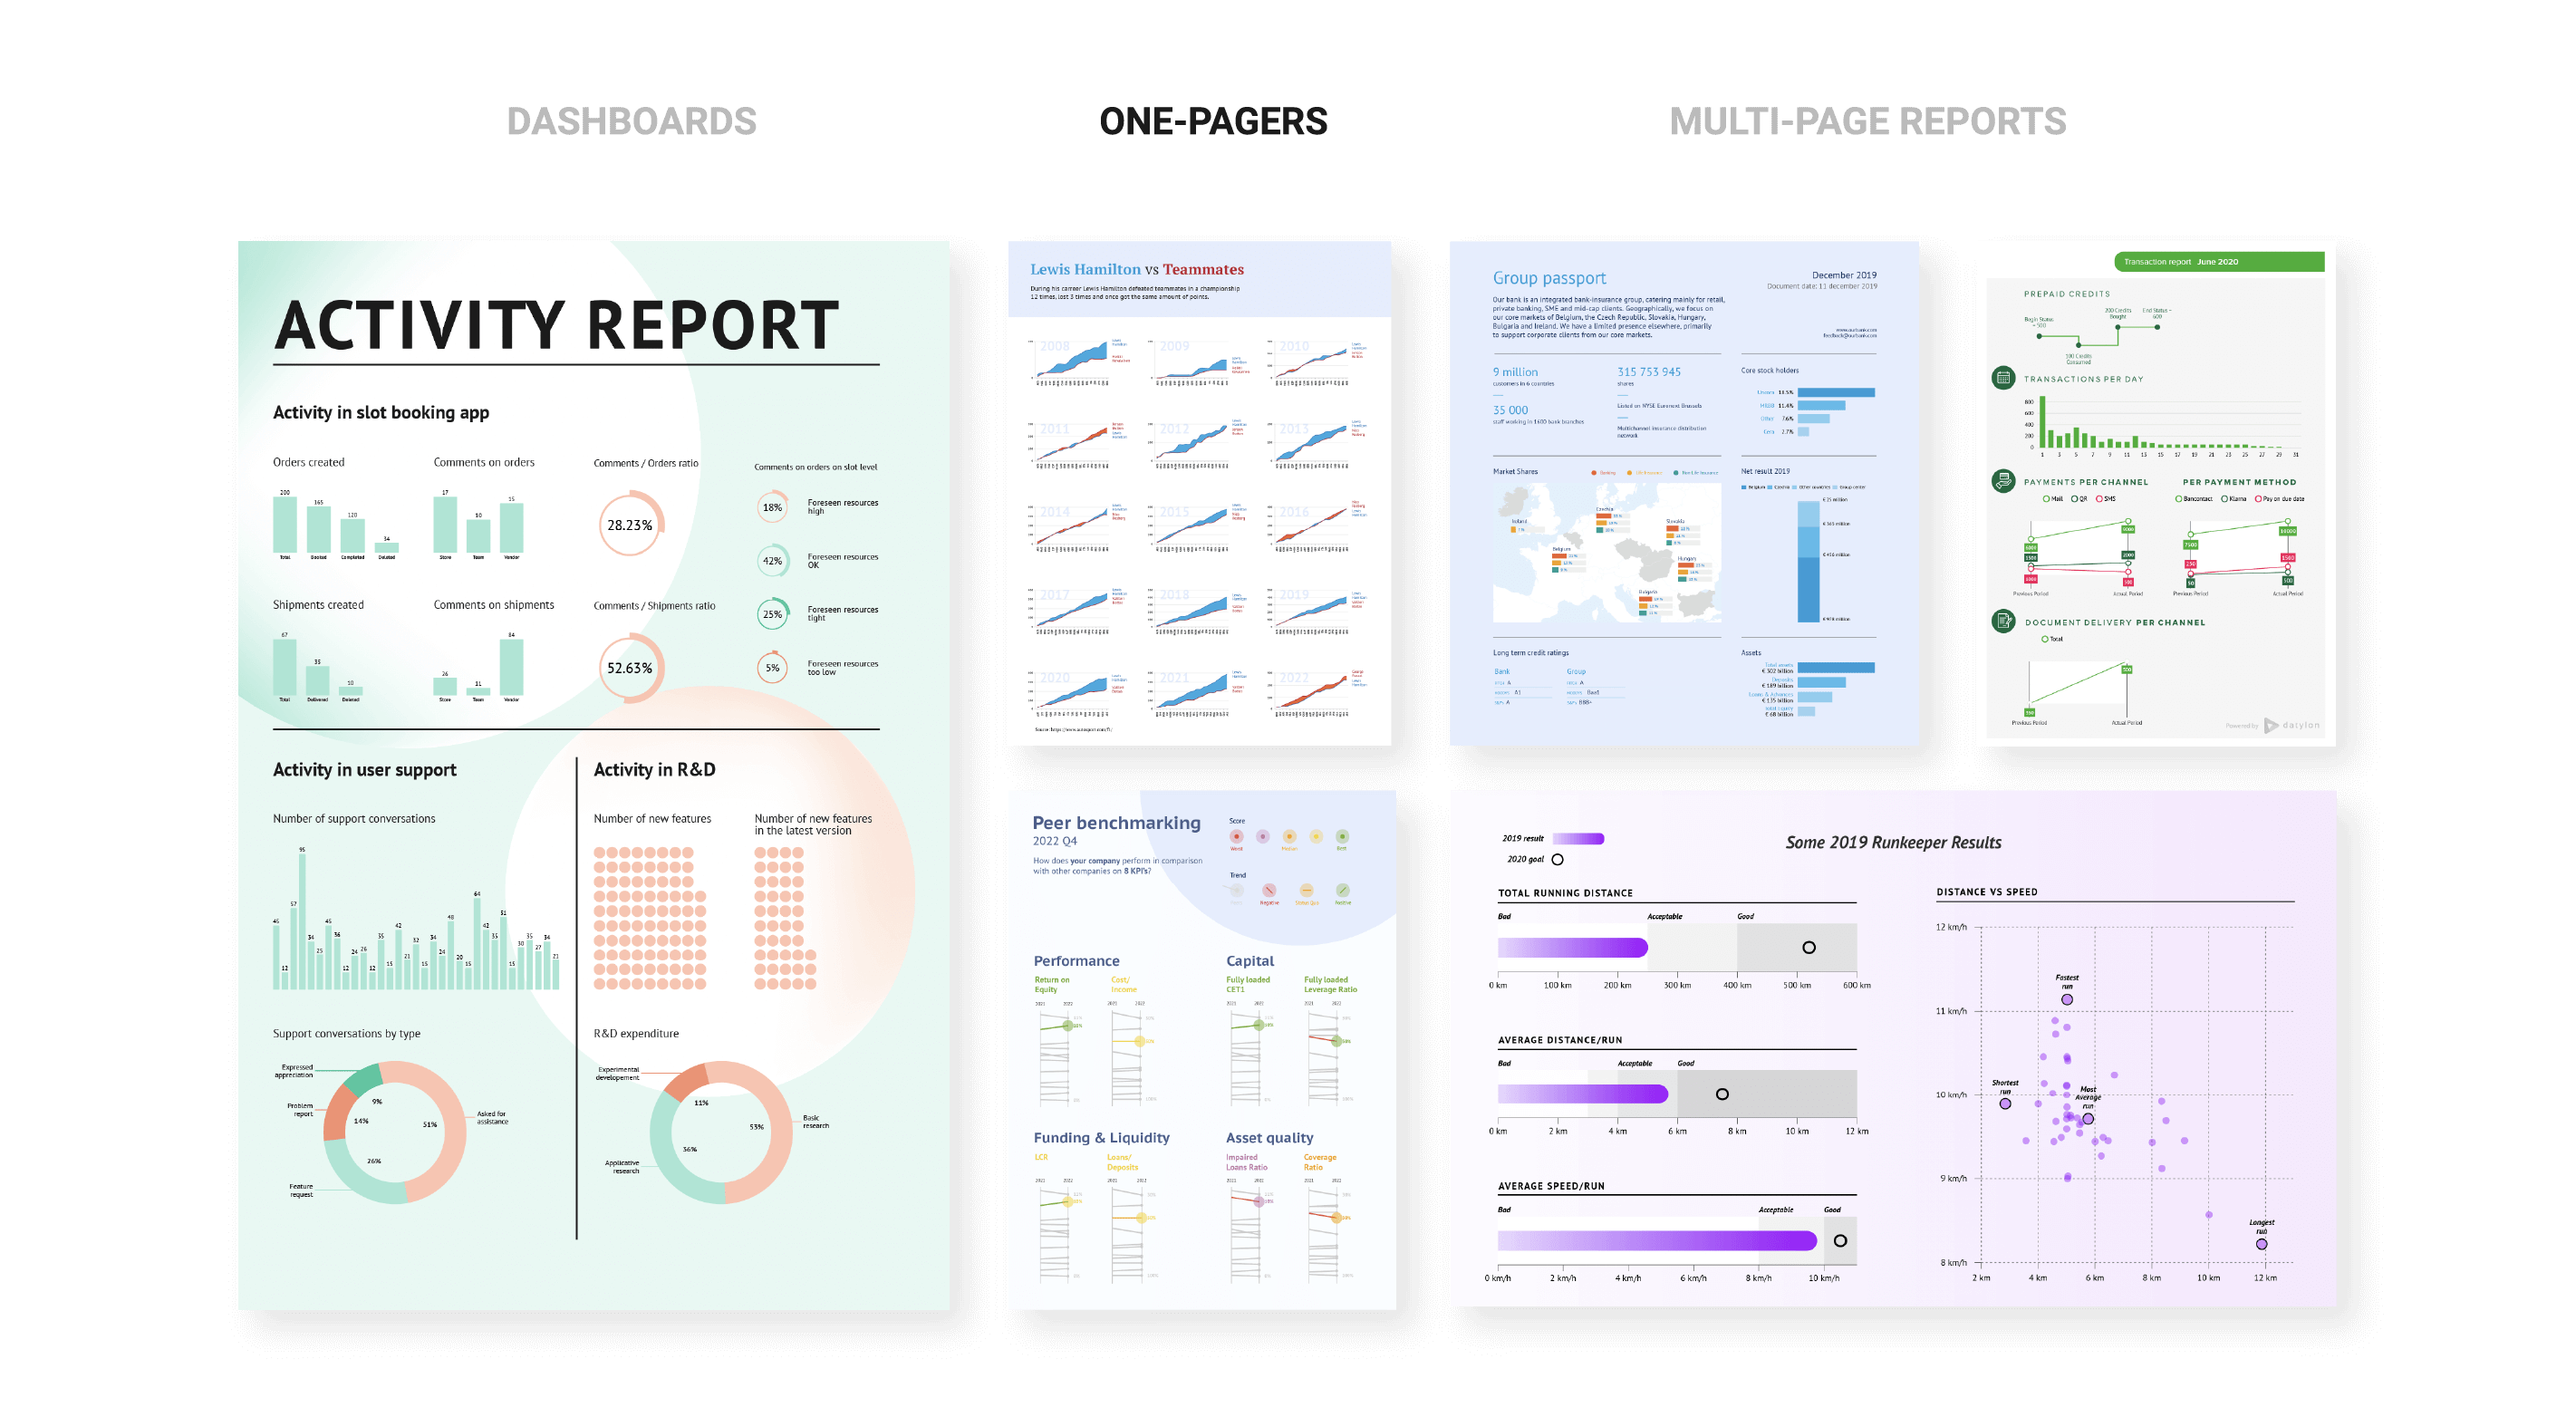
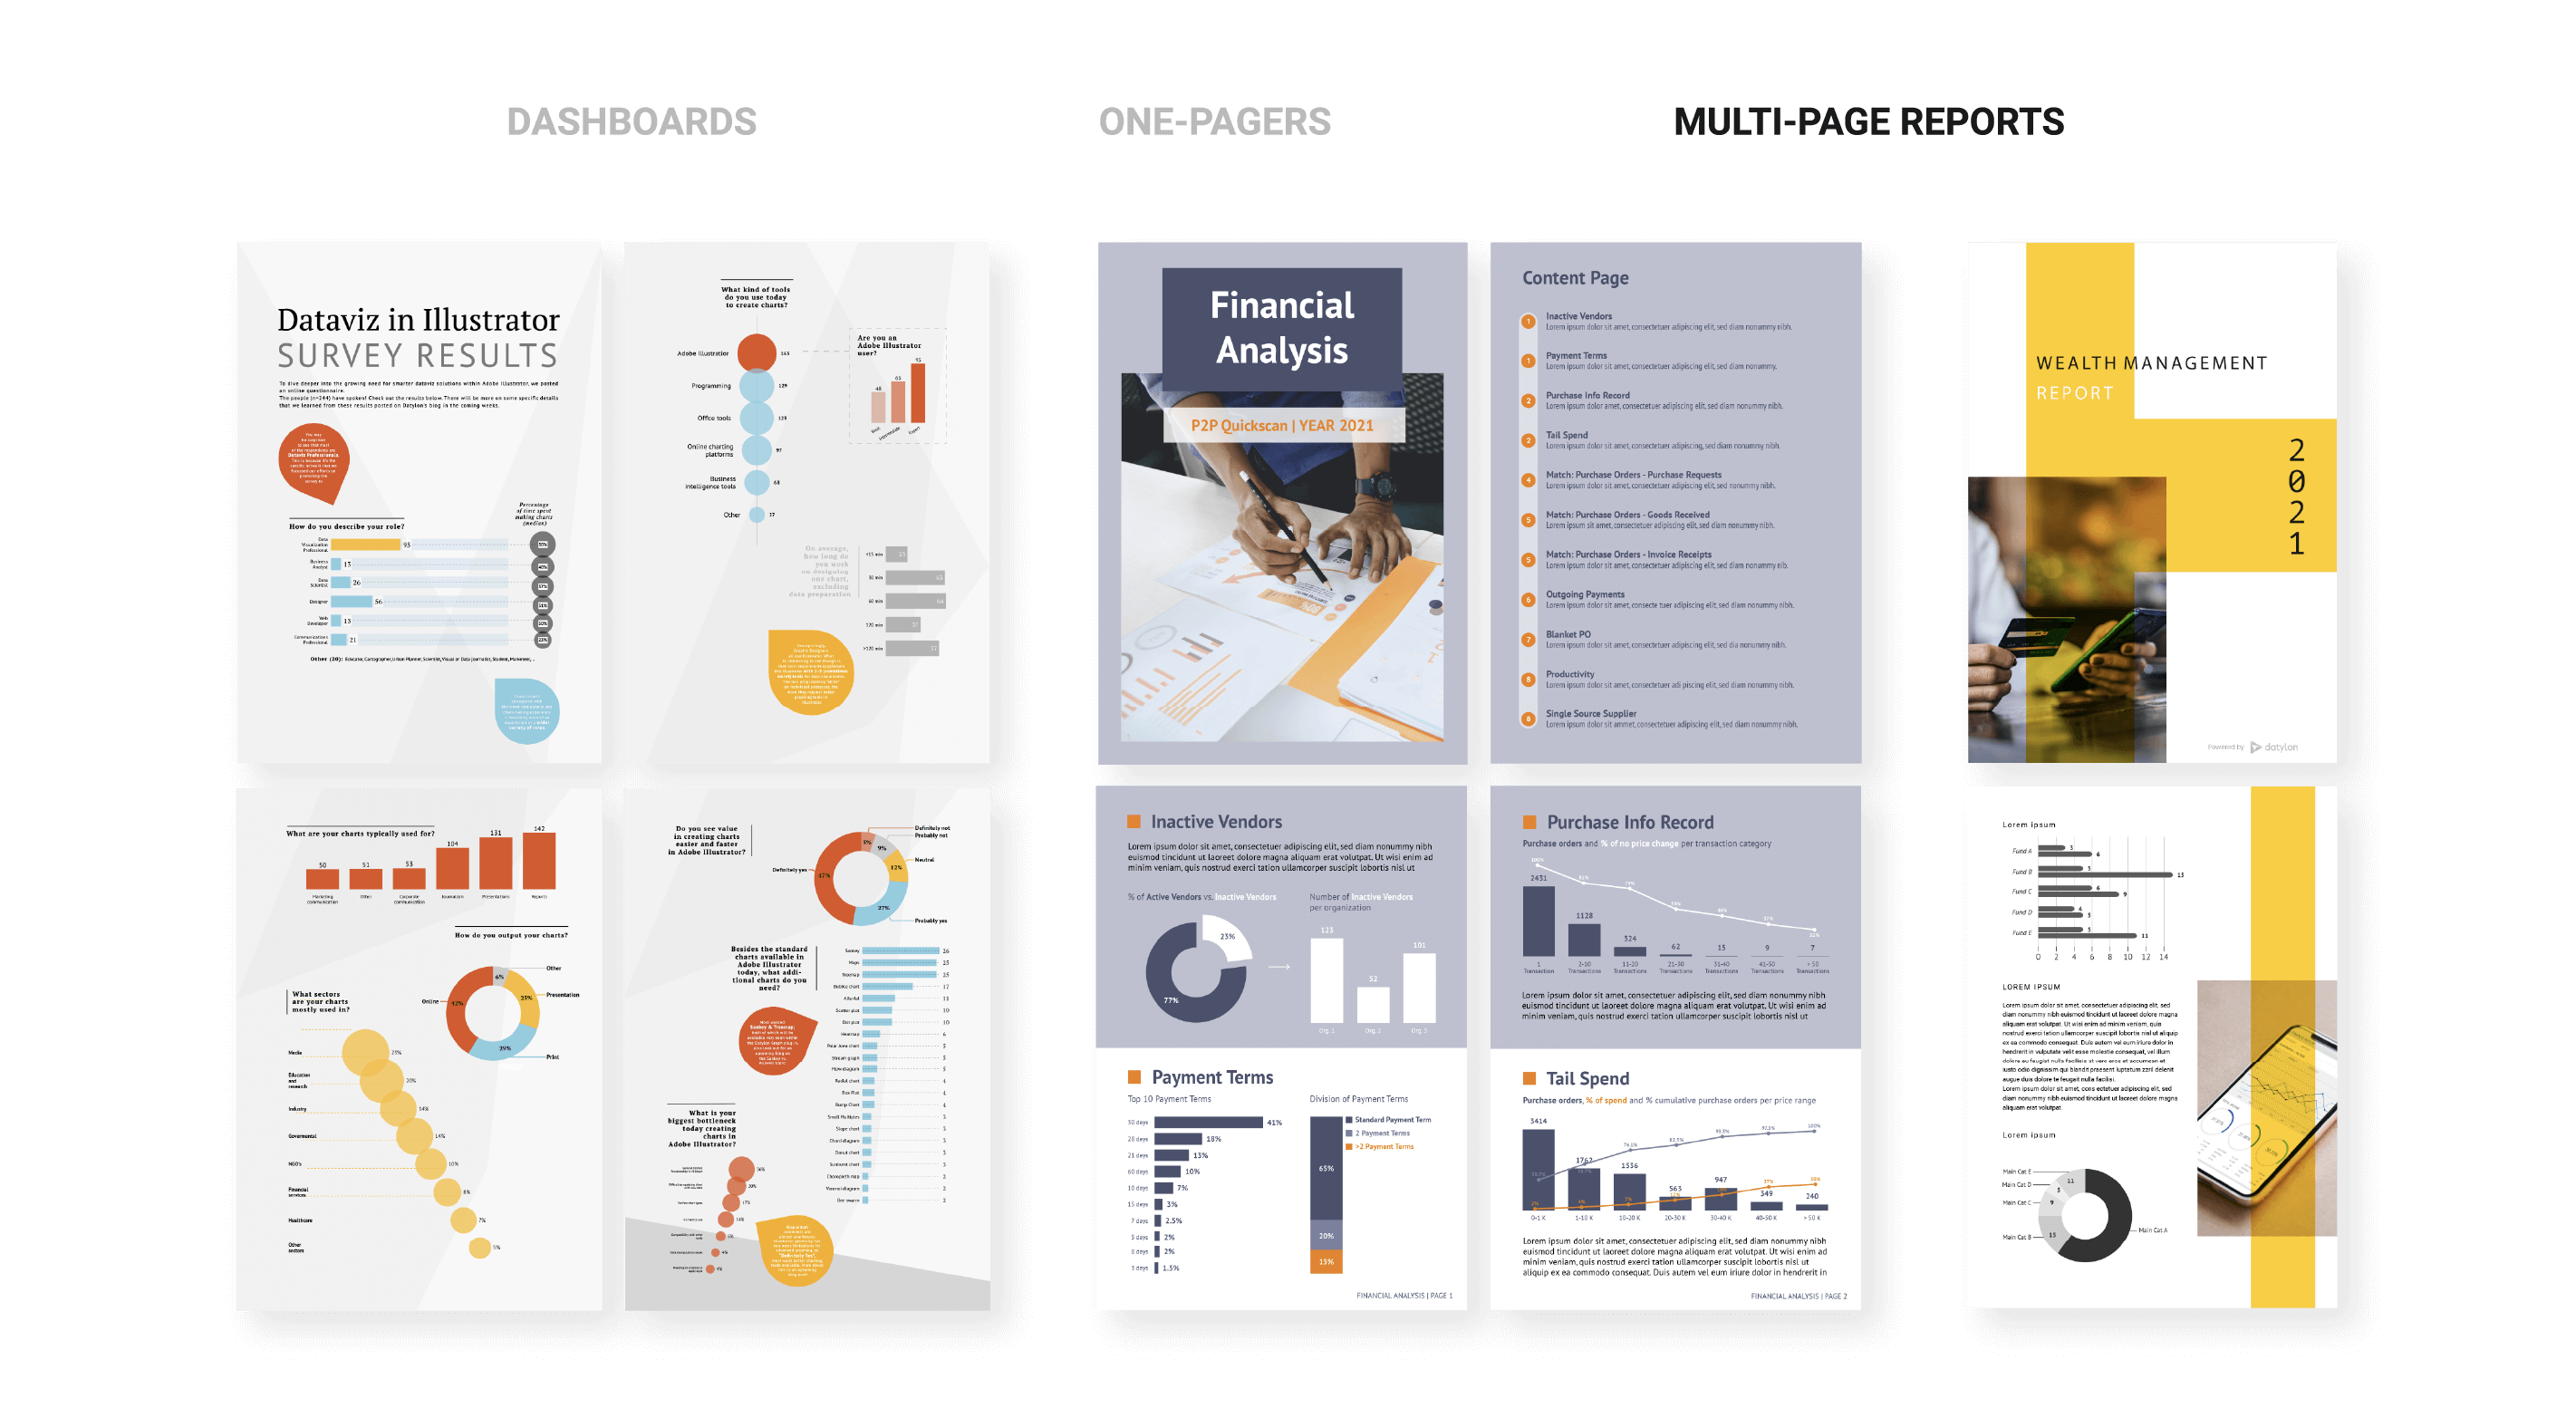
Datylon offers the perfect toolset to create the widest range of data-rich documents efficiently. From single charts, infographics, and dashboards, to large multi-page reports with hundreds of charts.
Start creating your own data stories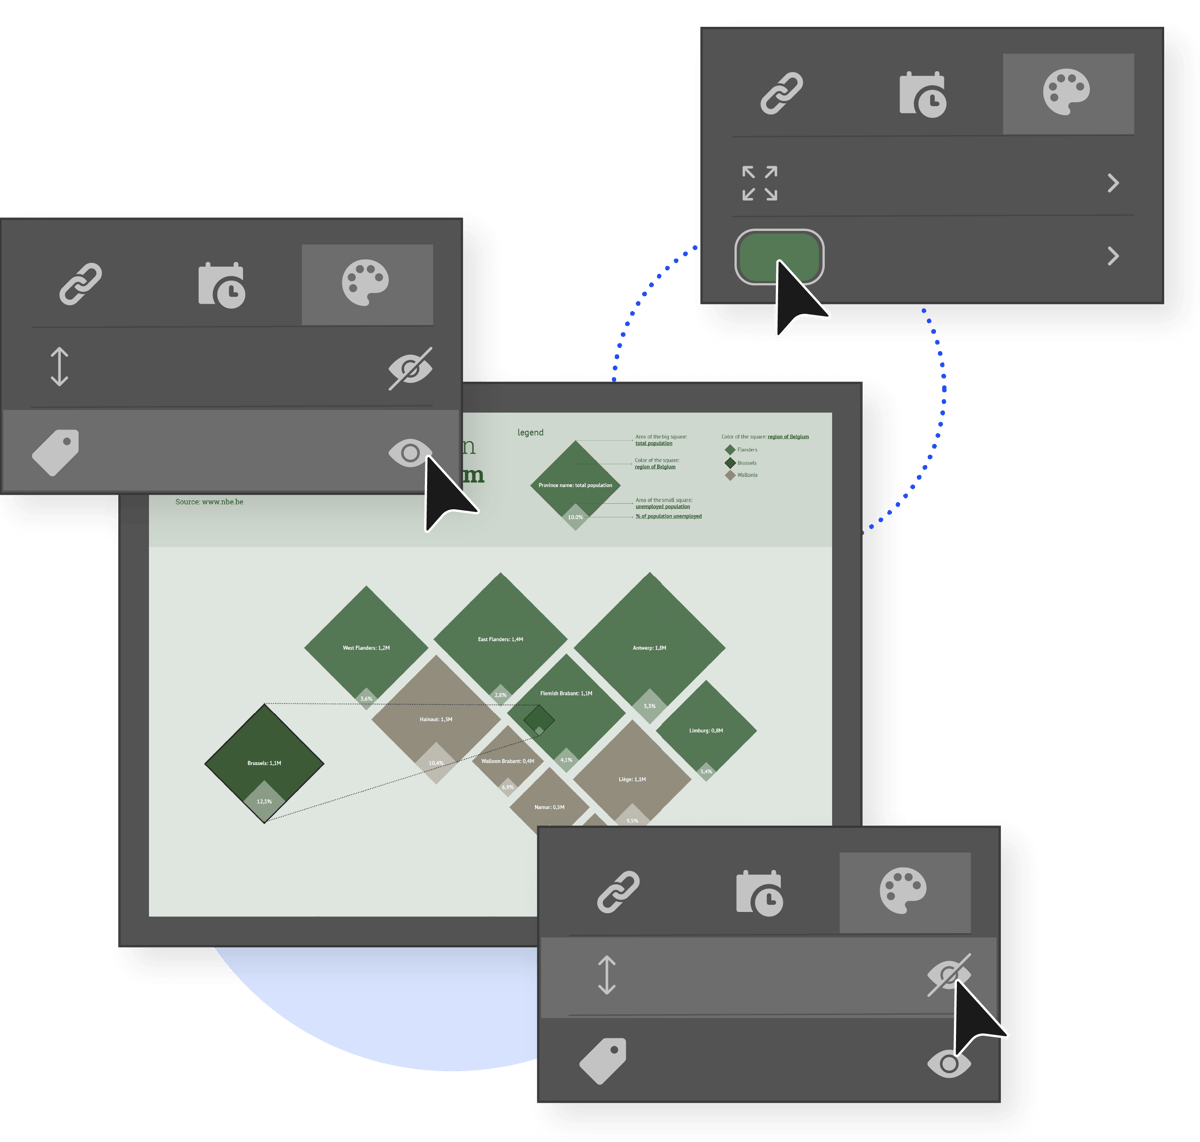
Unlimited styling properties
Experience the full freedom of design! All chart elements can be styled to the smallest detail: labels, data marks, axes... Data-driven styling can be applied to facilitate re-usability or automation. Anything can be set to align your report design with the brand’s style guide.
Get started with your design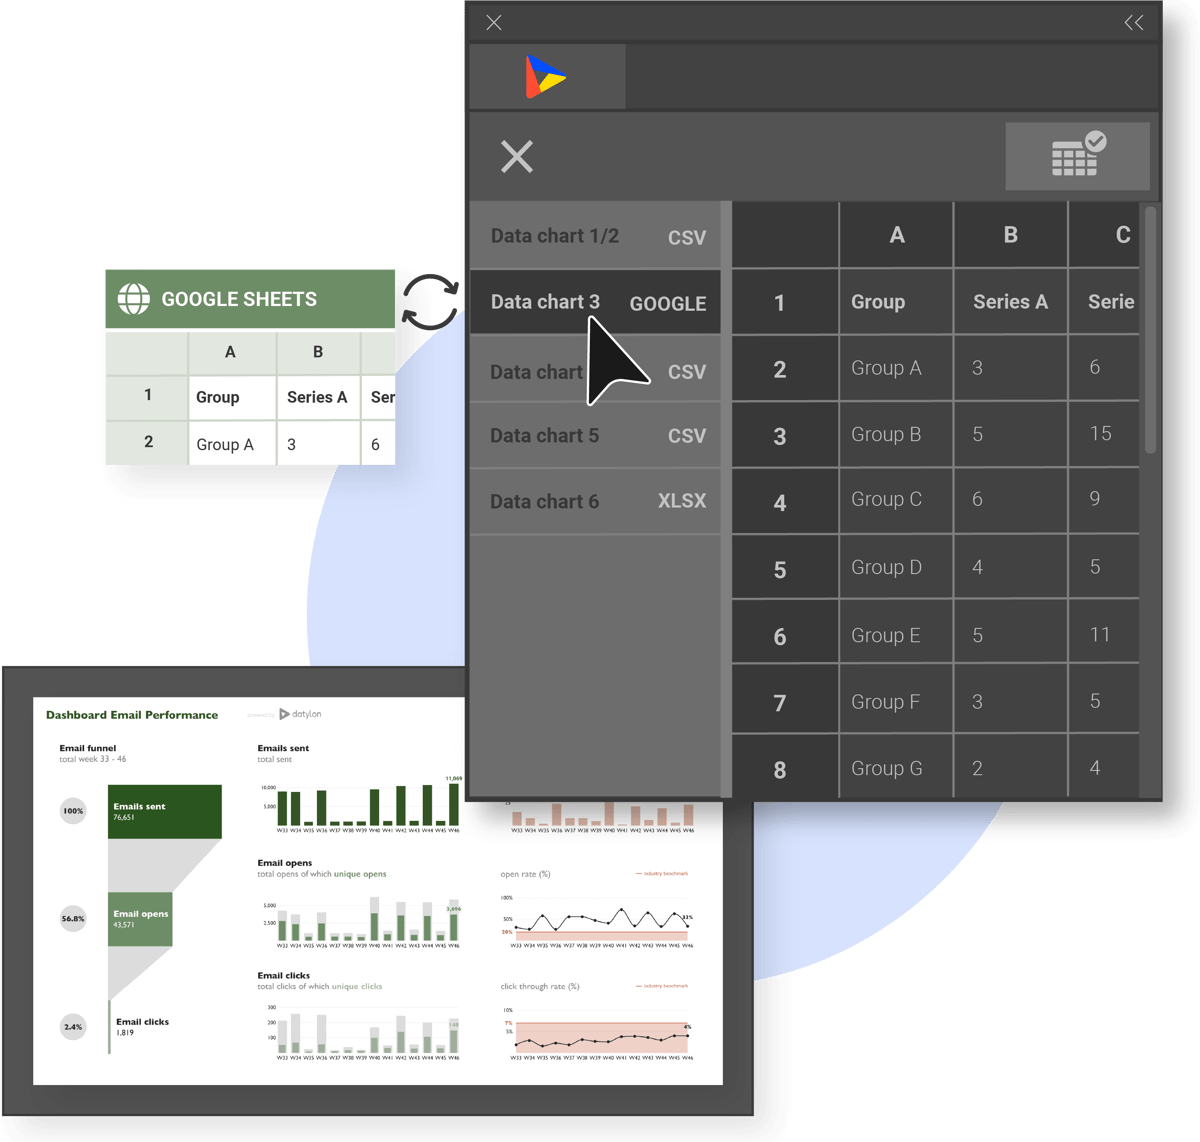
One-click data updates
All charts in your reports can be easily updated with new data in the blink of an eye. Upload data from a file (.xls, .xlsx and .csv) or link to an online data source (Google Sheets, OneDrive Excel) and keep everything nicely organized in the data manager.
Try it yourself for free for 14 days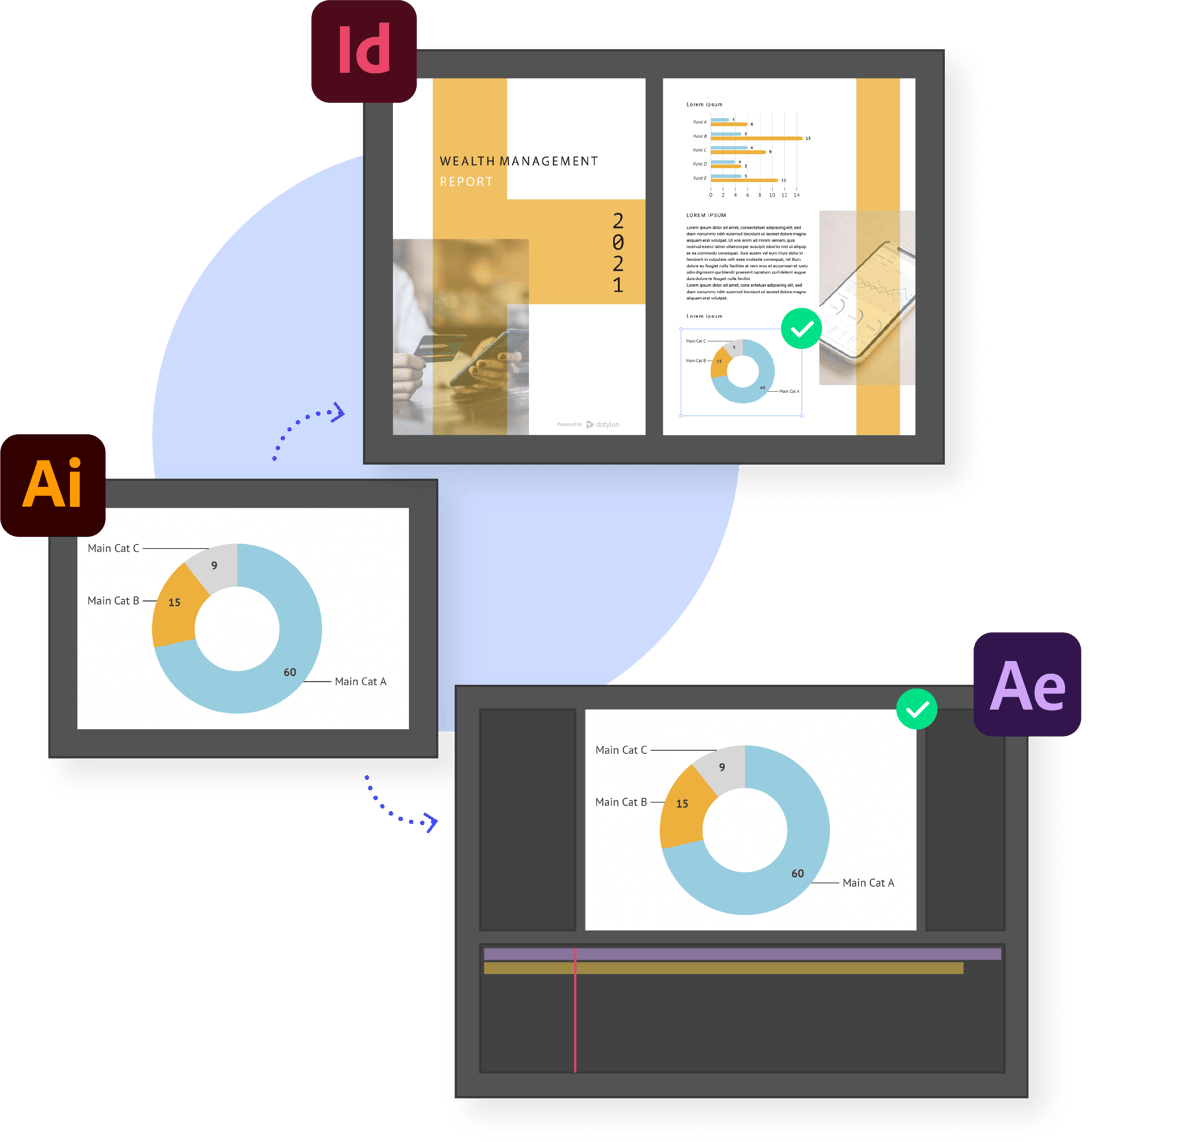
Hook in on Adobe Creative Cloud
Work seamlessly with InDesign. For extensive paginated reports, import your Datylon charts in InDesign while keeping those charts up to date in Illustrator. Import Illustrator files with Datylon charts in After Effects and create animated charts in minutes.
Get started for free, no credit card neededA powerful toolbox for your report design
Start building engaging data stories with Datylon's robust reporting tools. From designing & creation to automation, we've got you covered.
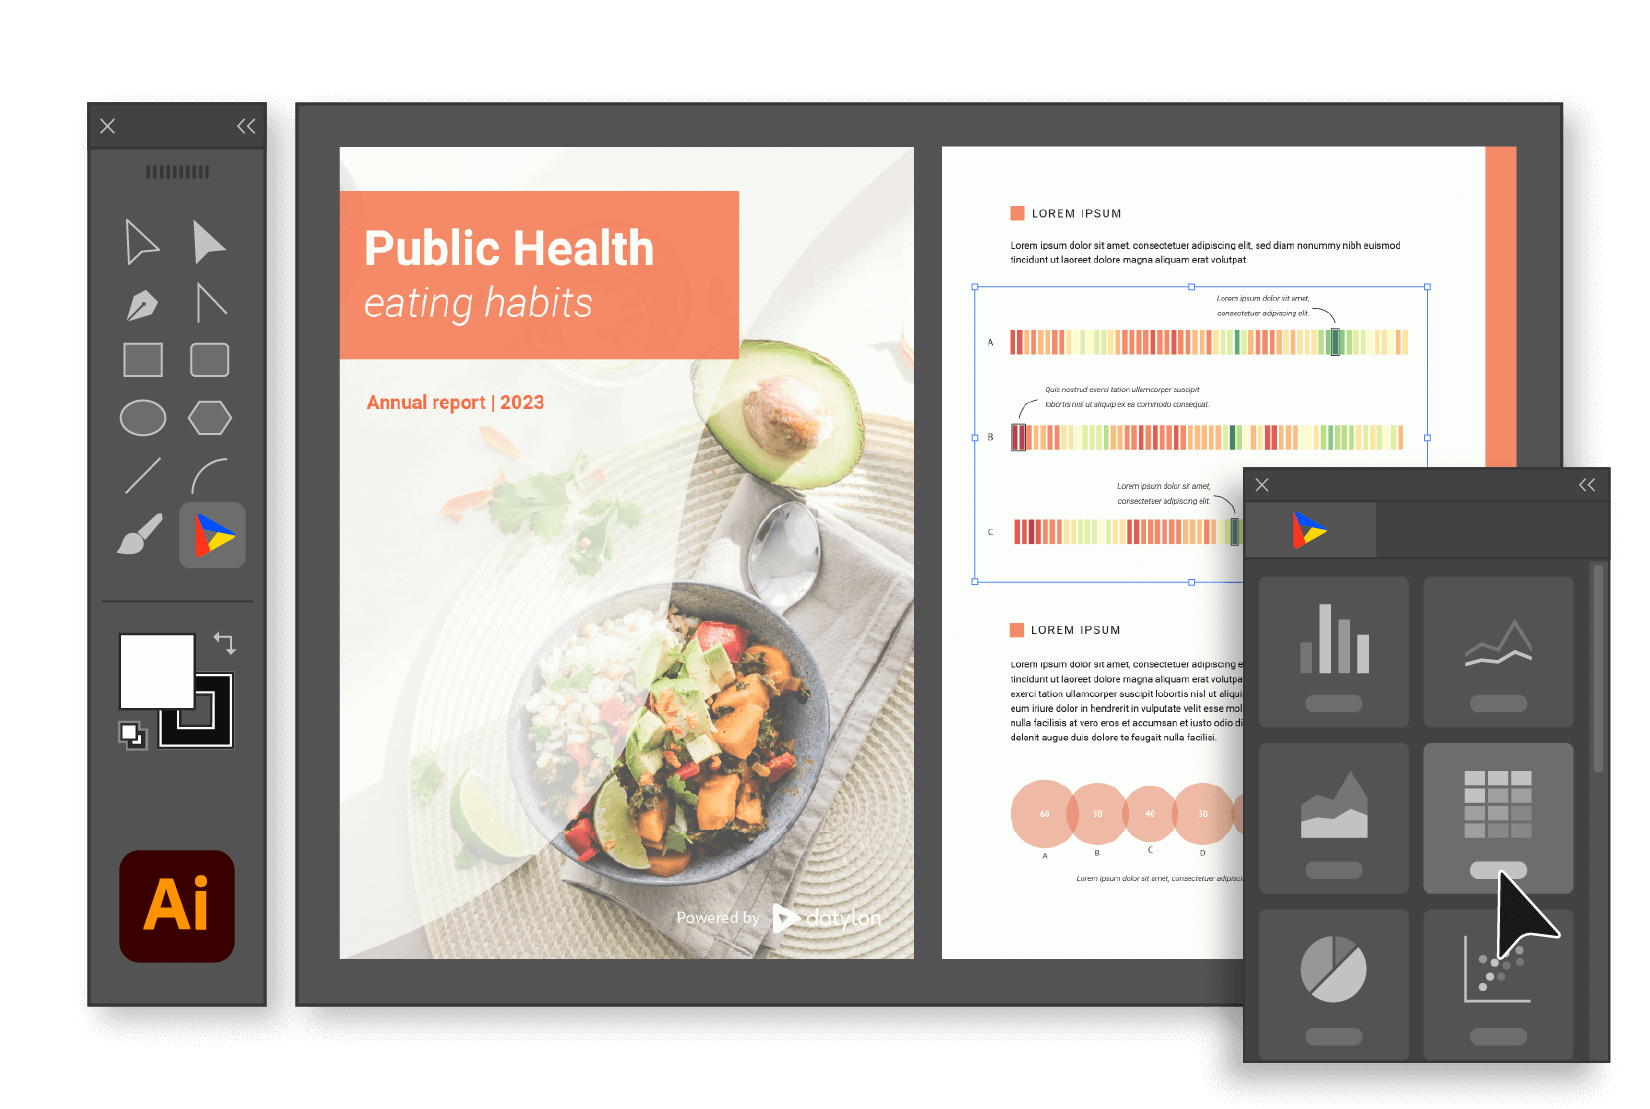
Datylon for Illustrator
Design beautiful charts and report templates right within Adobe Illustrator.
Discover the plug-in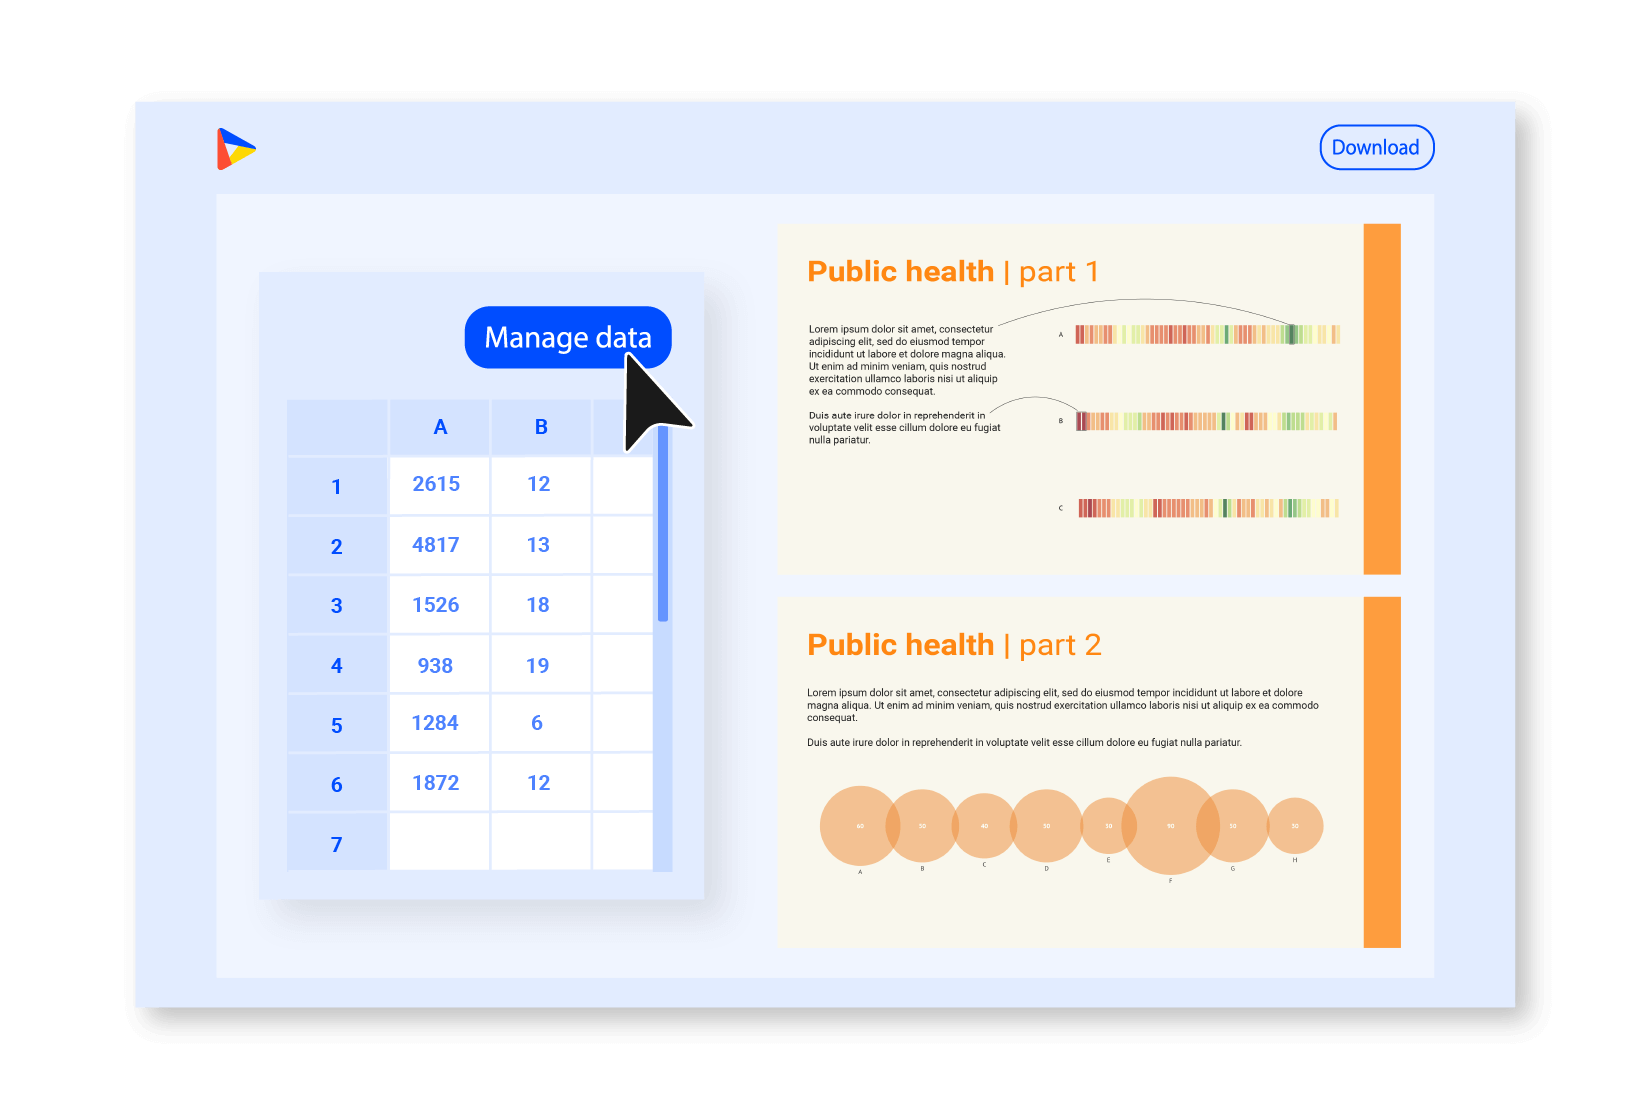
Datylon Report Studio
Produce on-brand, periodic reports based on your pre-designed templates.
See how it works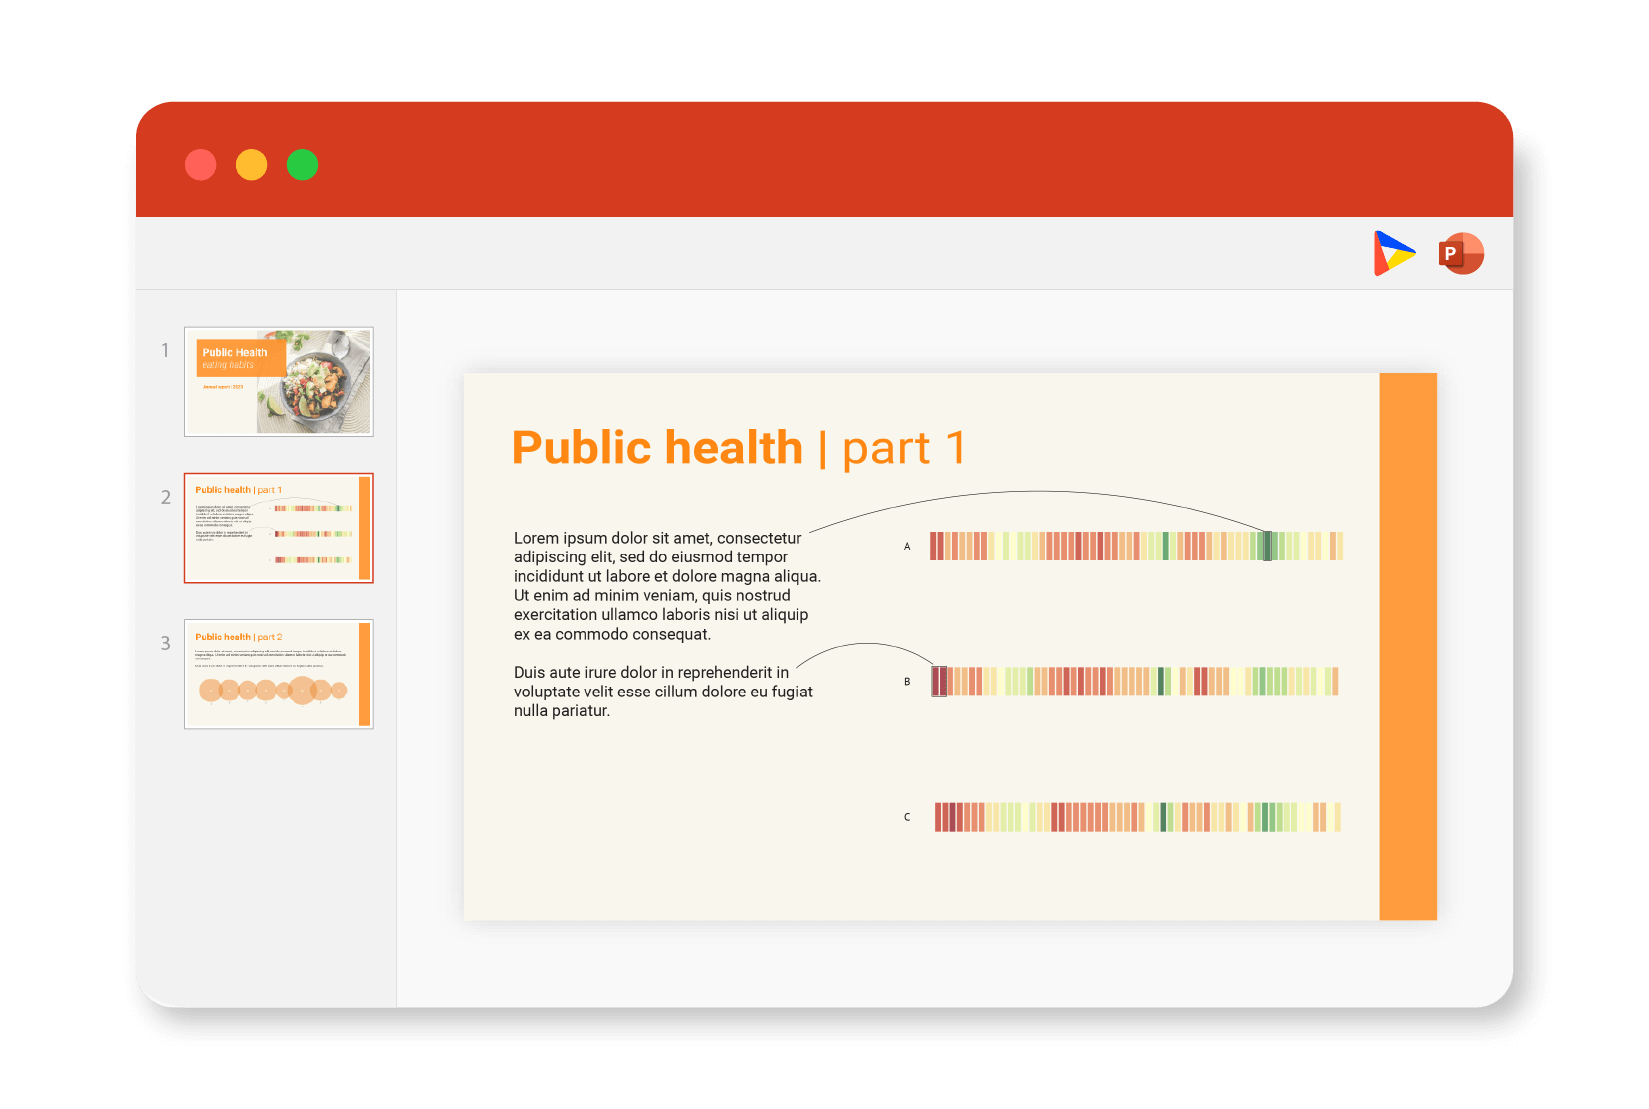
Datylon for PowerPoint
Datylon add-in for PowerPoint to enrich your presentations with beautiful charts.
Read moreHear it from other designers
Discover how our tools helped others create beautiful report designs.
All reviews come from verified Datylon users.
Find report design inspiration
Find inspiration or get ready-to-use report templates in our Inspiration gallery. Scroll through and download any design to edit or modify in Illustrator.
Good to know (FAQ)
Here are a few important things to note about Datylon.
If you still have questions, you can check out our Help Center.
How can I use Datylon for small scale report design project?
For a small-scale project, the ideal approach is to create your report directly in Adobe Illustrator by designing Datylon charts and placing them onto the pages right away. It will also allow to update all the charts at once using swap workbook functionality, allowing to create different iterations of you report.
How can I use Datylon for Illustrator in combination with InDesign for report creation?
For an average scale report project where InDesign is essential, you can use Datylon for Illustrator as a chart source. All the charts can be placed on a separate dashboards and then placed into InDesign document. In this case the chart update will be a two-step process. First is updating the data using swap workbook and then applying the changes in InDesign.
How can I automate report design creation using Datylon.
The first step is creating templates using Datylon for the Illustrator plugin. It provides the all power of Illustrator combined with the extensive chart styling possibilities of Datylon.
The second step is exporting templates to Datylon Report Studio.
The third step is providing data to our Render Server via a custom service or application.
After everything is set up the Render Server is ready to generate your report.
You can learn more on our dedicated Report Automation page
We don't have a designer on our team. Can you help us create the fully designed report?
Absolutely! Our team is equipped with experts in graphic design, report creation, and data visualization design, ready to assist in crafting the complete design of your report and selecting the perfect visuals to effectively communicate your ideas.
Our report is planned to be recurring. Does it mean that we should start from scratch every time?
No! Datylon is perfect for creating recurring reports. Once you created your templates and set up your data transformation flow, there are no limits to creating a multiple version or iterations of your report.
How can we split the work in our team using Datylon for optimizing the report creation flow?
The best workflow is the following. Designers create the layout of the report and data visualizations using Datylon for Illustrator. Then export them as templates to Report Studio.
After the templates are exported to Report Studio, other specialists can update data and adjust the styling of the charts.
Developers and data engineers can set up a data pipeline to deliver the data to the Render Server.
Note that any of these tasks can be also performed on our side.
What about my privacy?
We take data security and privacy issues very seriously. Please check our privacy policy to learn more.
Is my data secure?
We store your data and visualizations in the Illustrator .ai files you edit. Your data and visualizations are not sent over the internet and the .ai file will be the only place where your data and visualizations are stored which means you have full data security control.
We need an internet connection to validate and activate your Datylon for Illustrator license when you start using Datylon for Illustrator for the first time. Thereafter no internet connection is needed anymore and Datylon for Illustrator will function without an internet connection till your license expires after which a new license check over the internet is needed.
If you save your data, charts or designs on Datylon's online dataviz platform, it will belong only to your account and you will have full control over it. We will treat your data as confidential while our system keeps all online user data in secure servers.
If you publish a project on our online dataviz platform, it can be accessed through a direct link with a unique ID. If you want to make sure nobody finds your visualizations, keep them unpublished and download them as PDFs, SVGs or images for private use.

