Histogram
DATYLON > CHART LIBRARY > HISTOGRAM
What is a histogram?
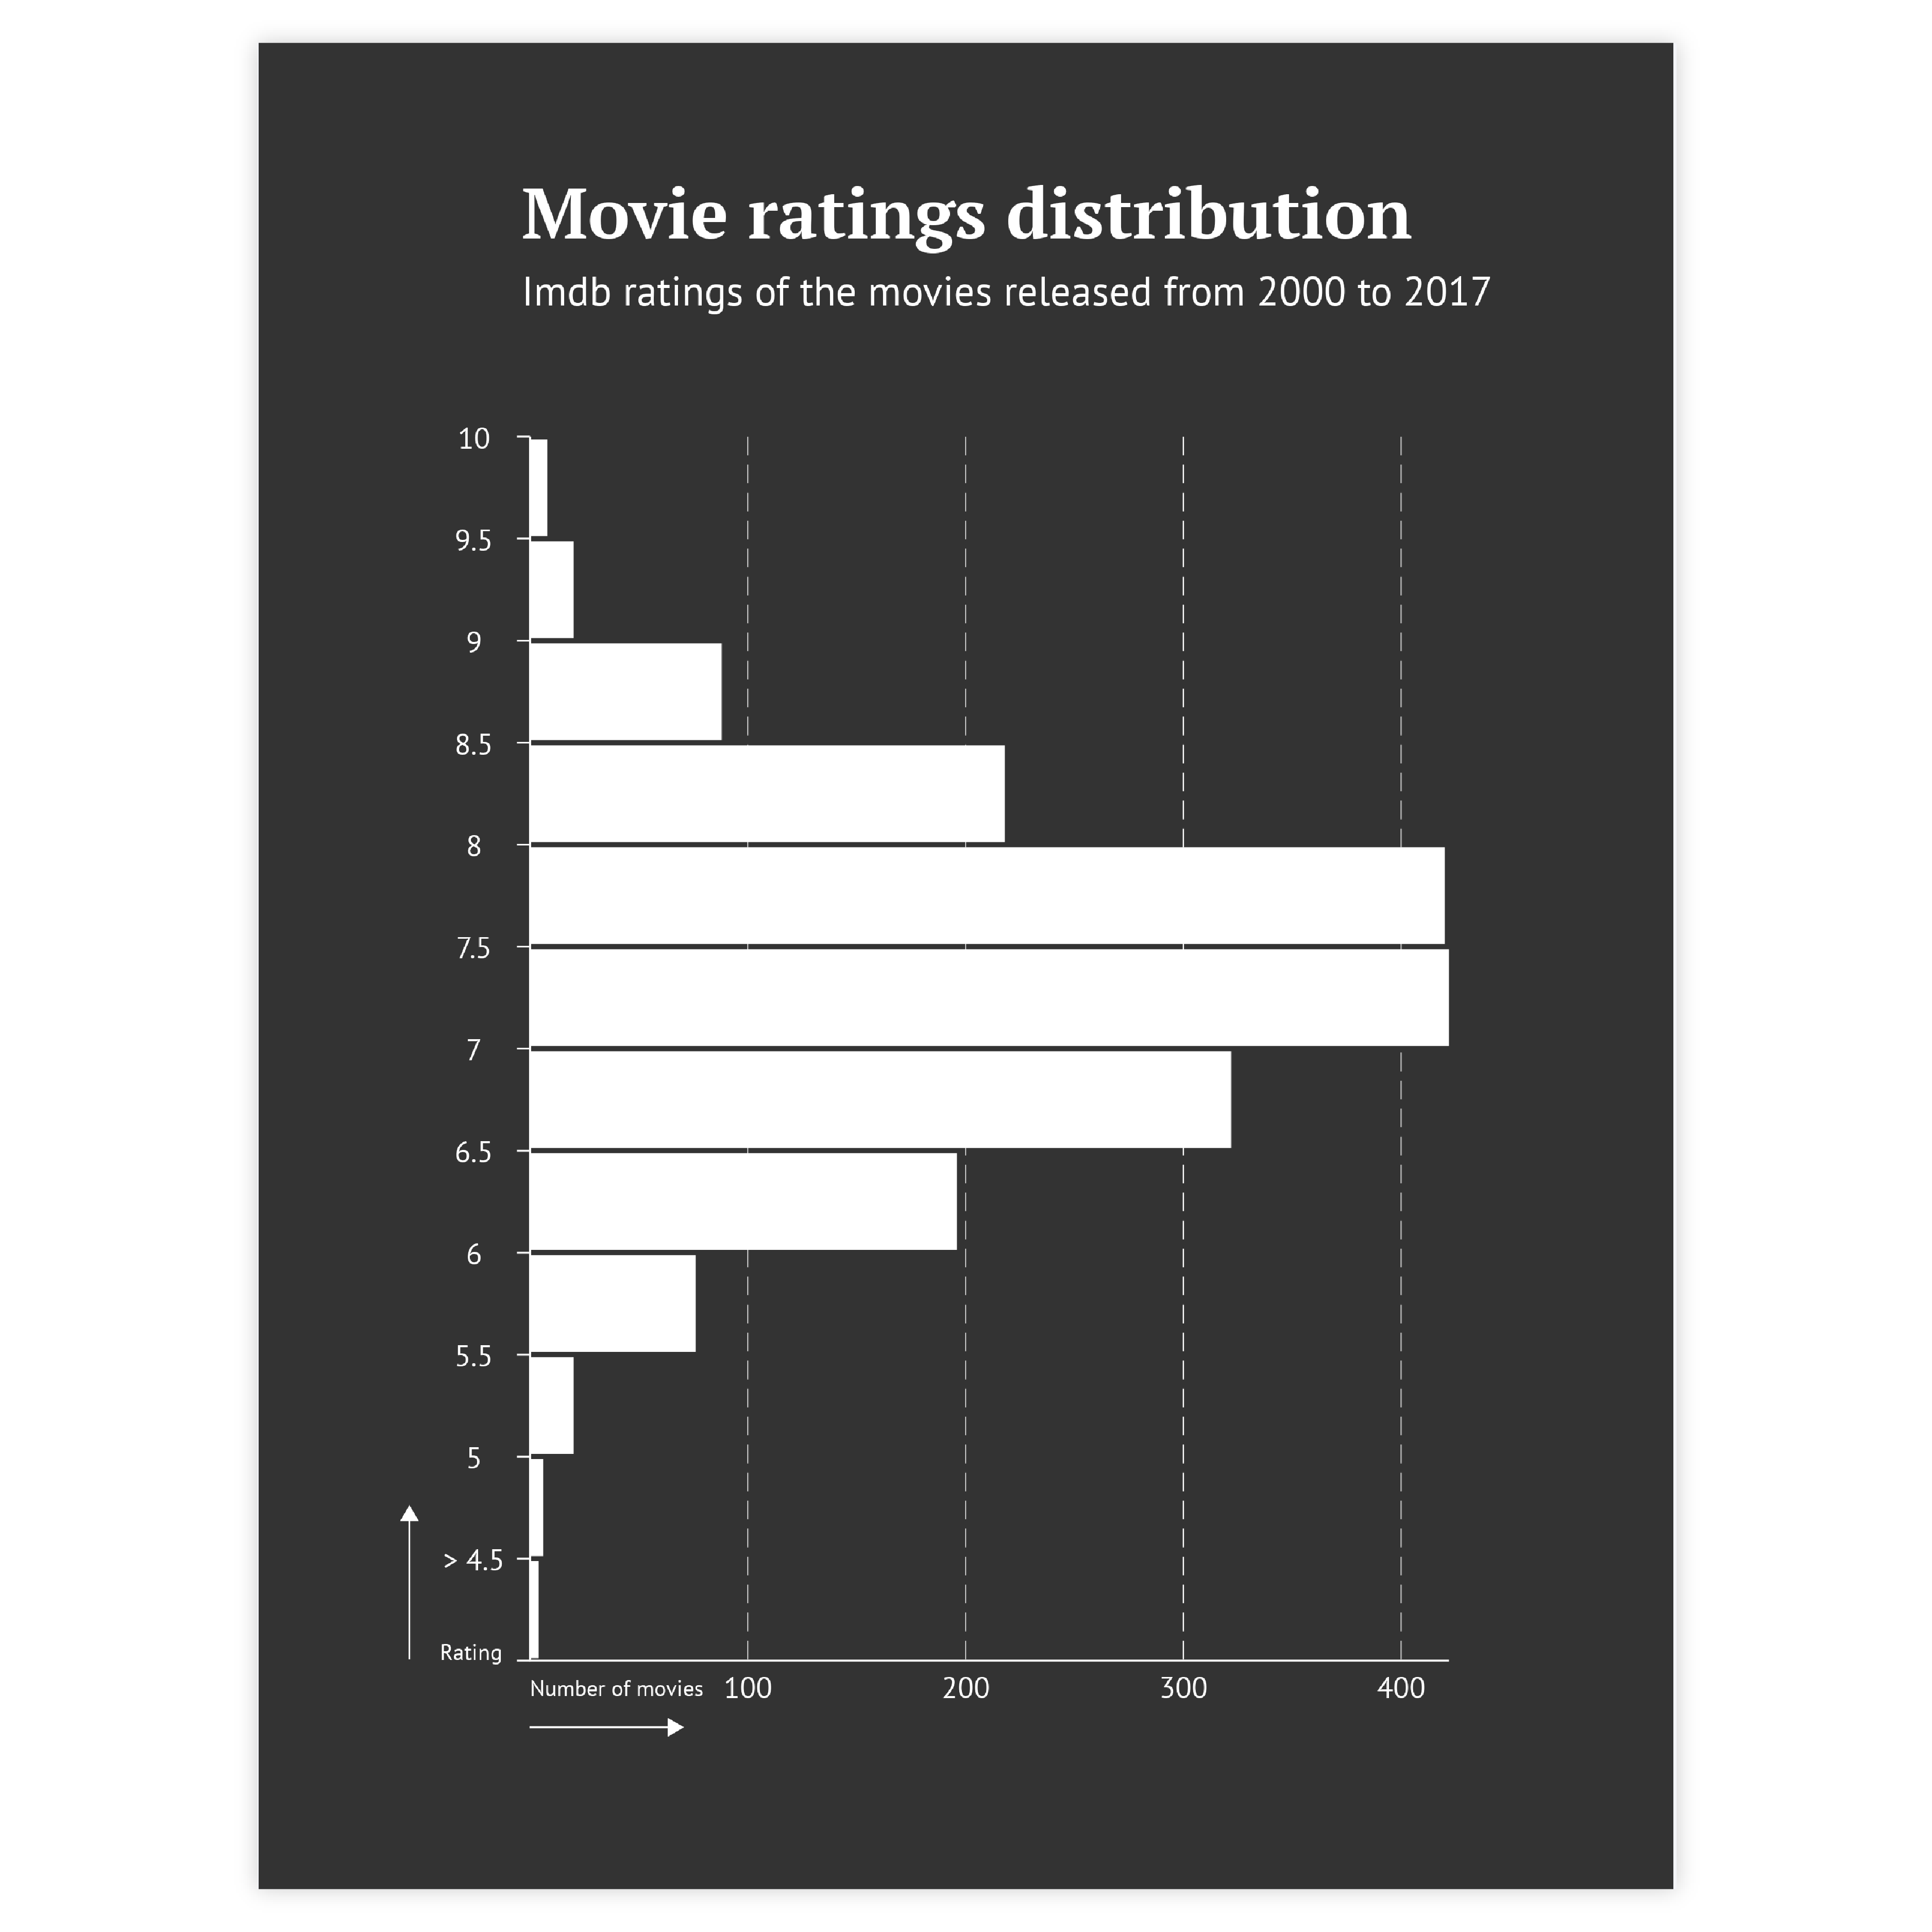
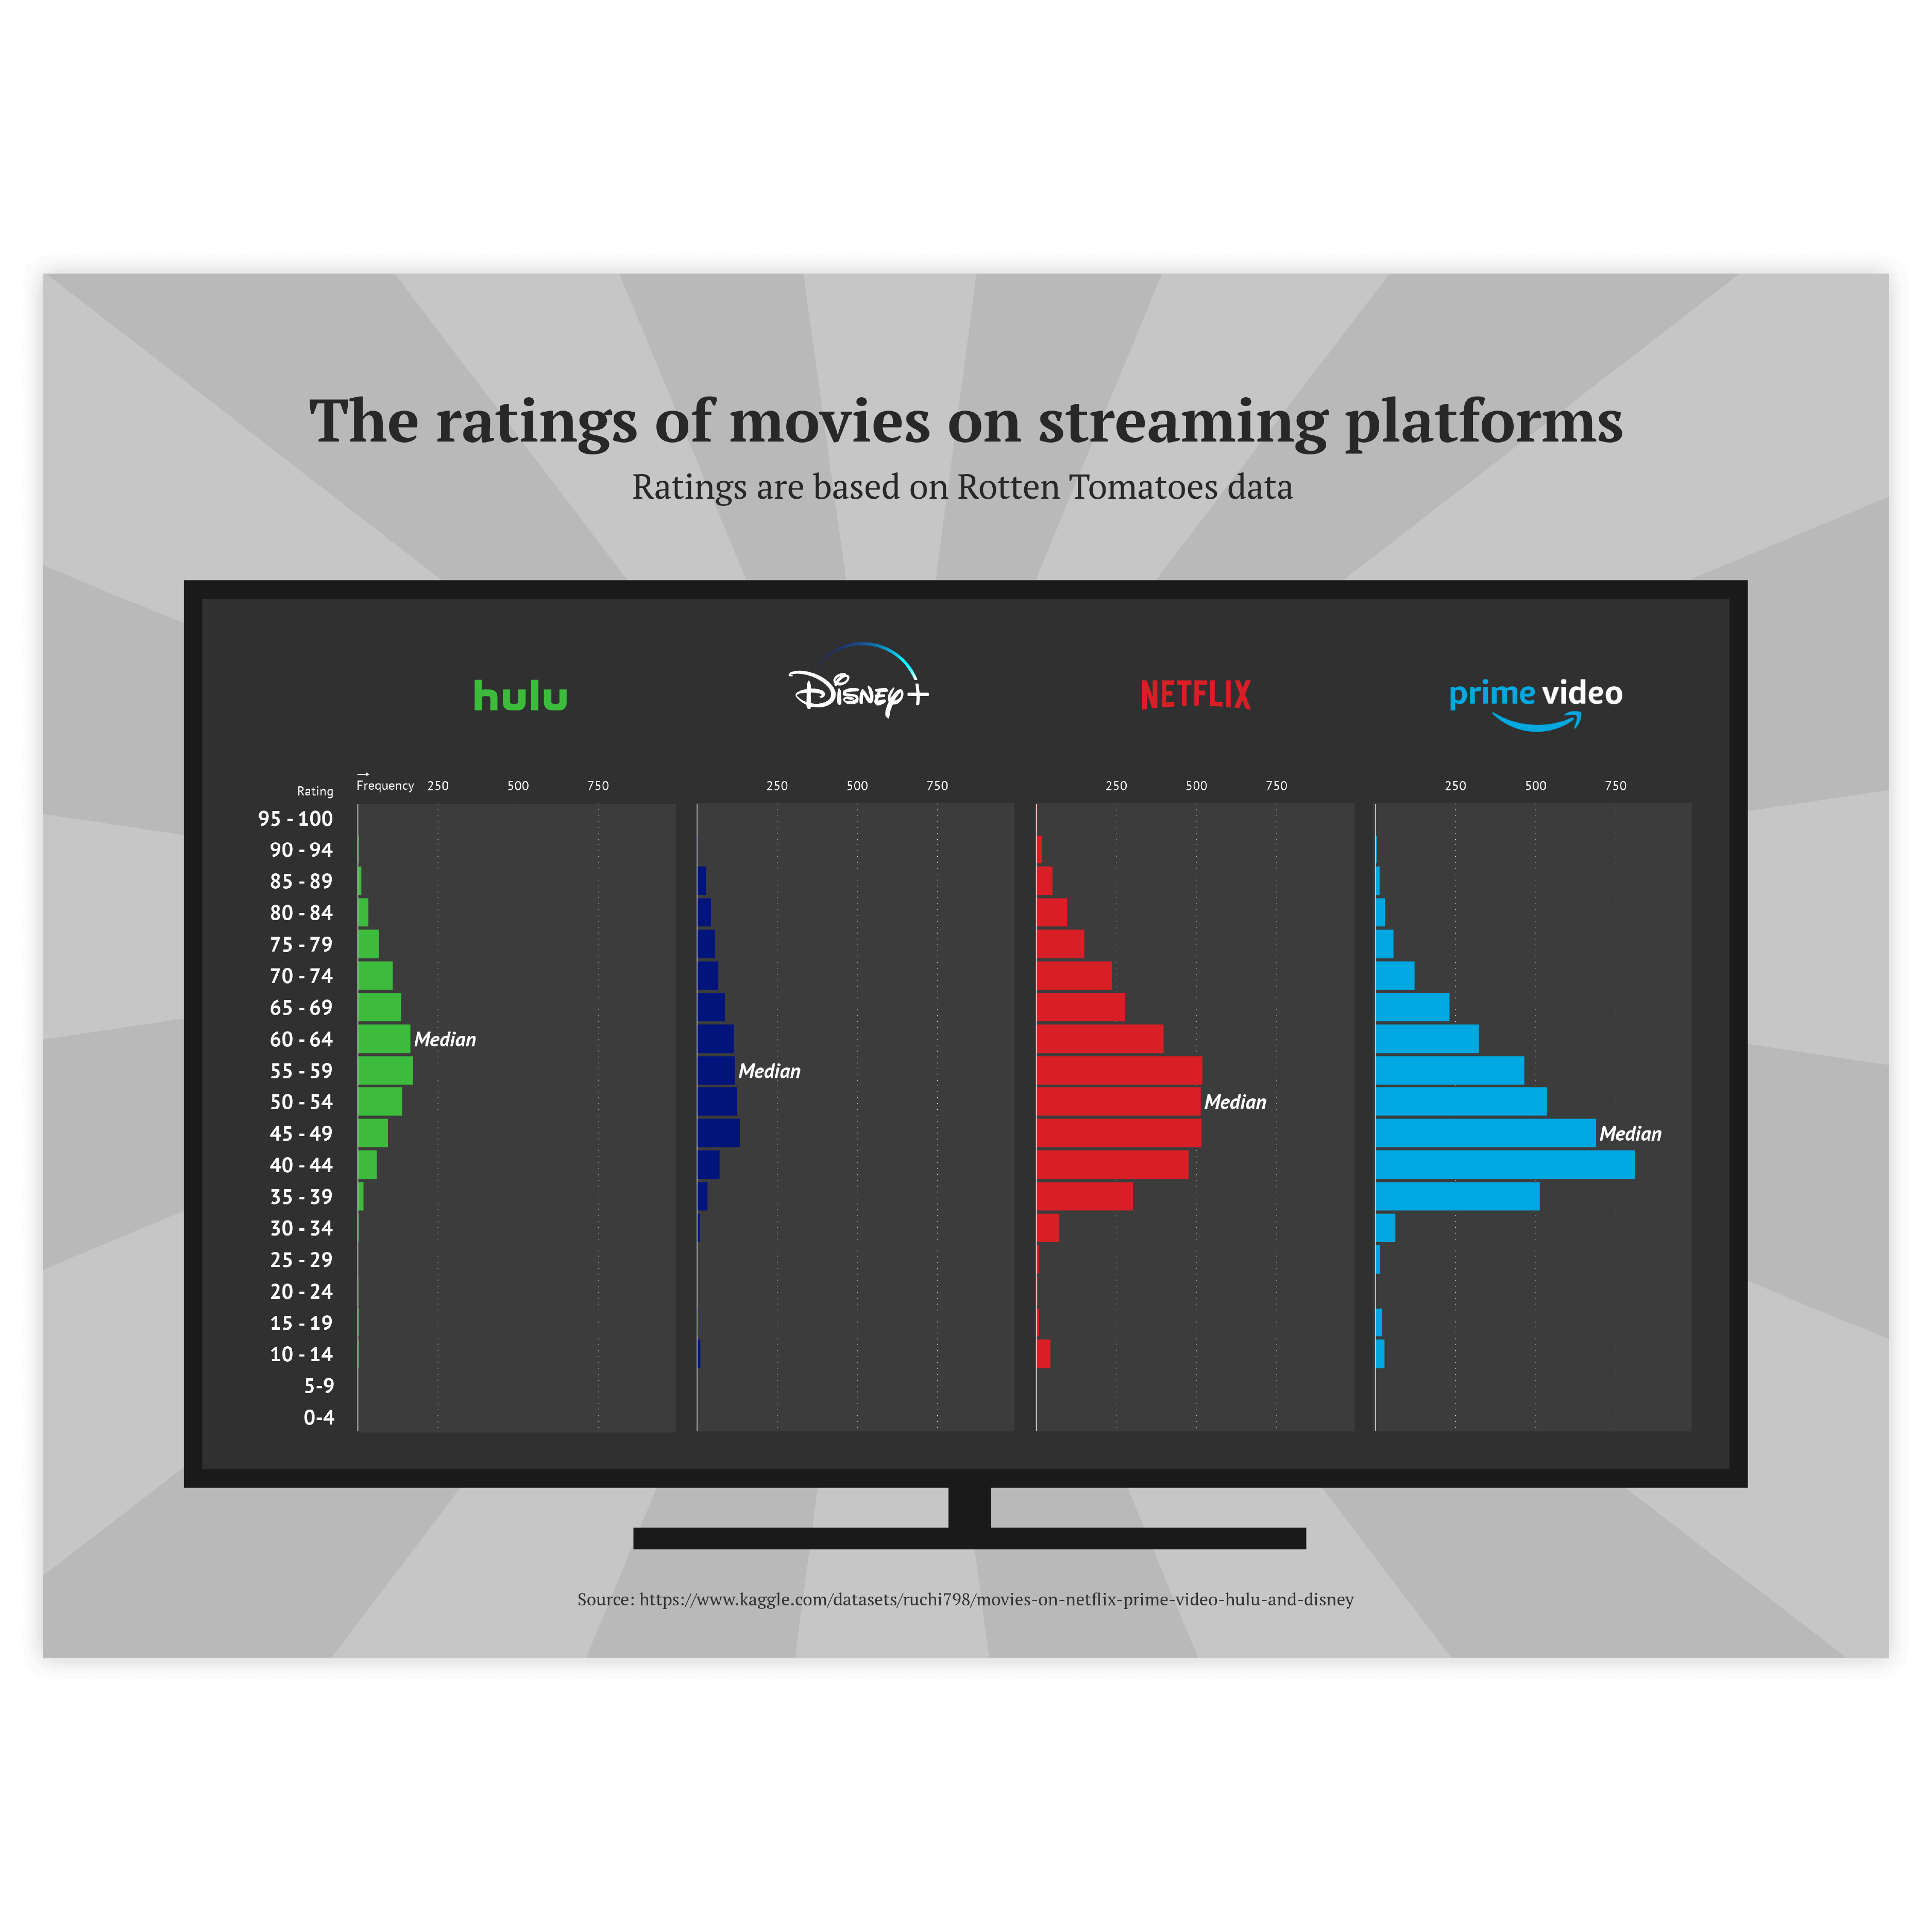
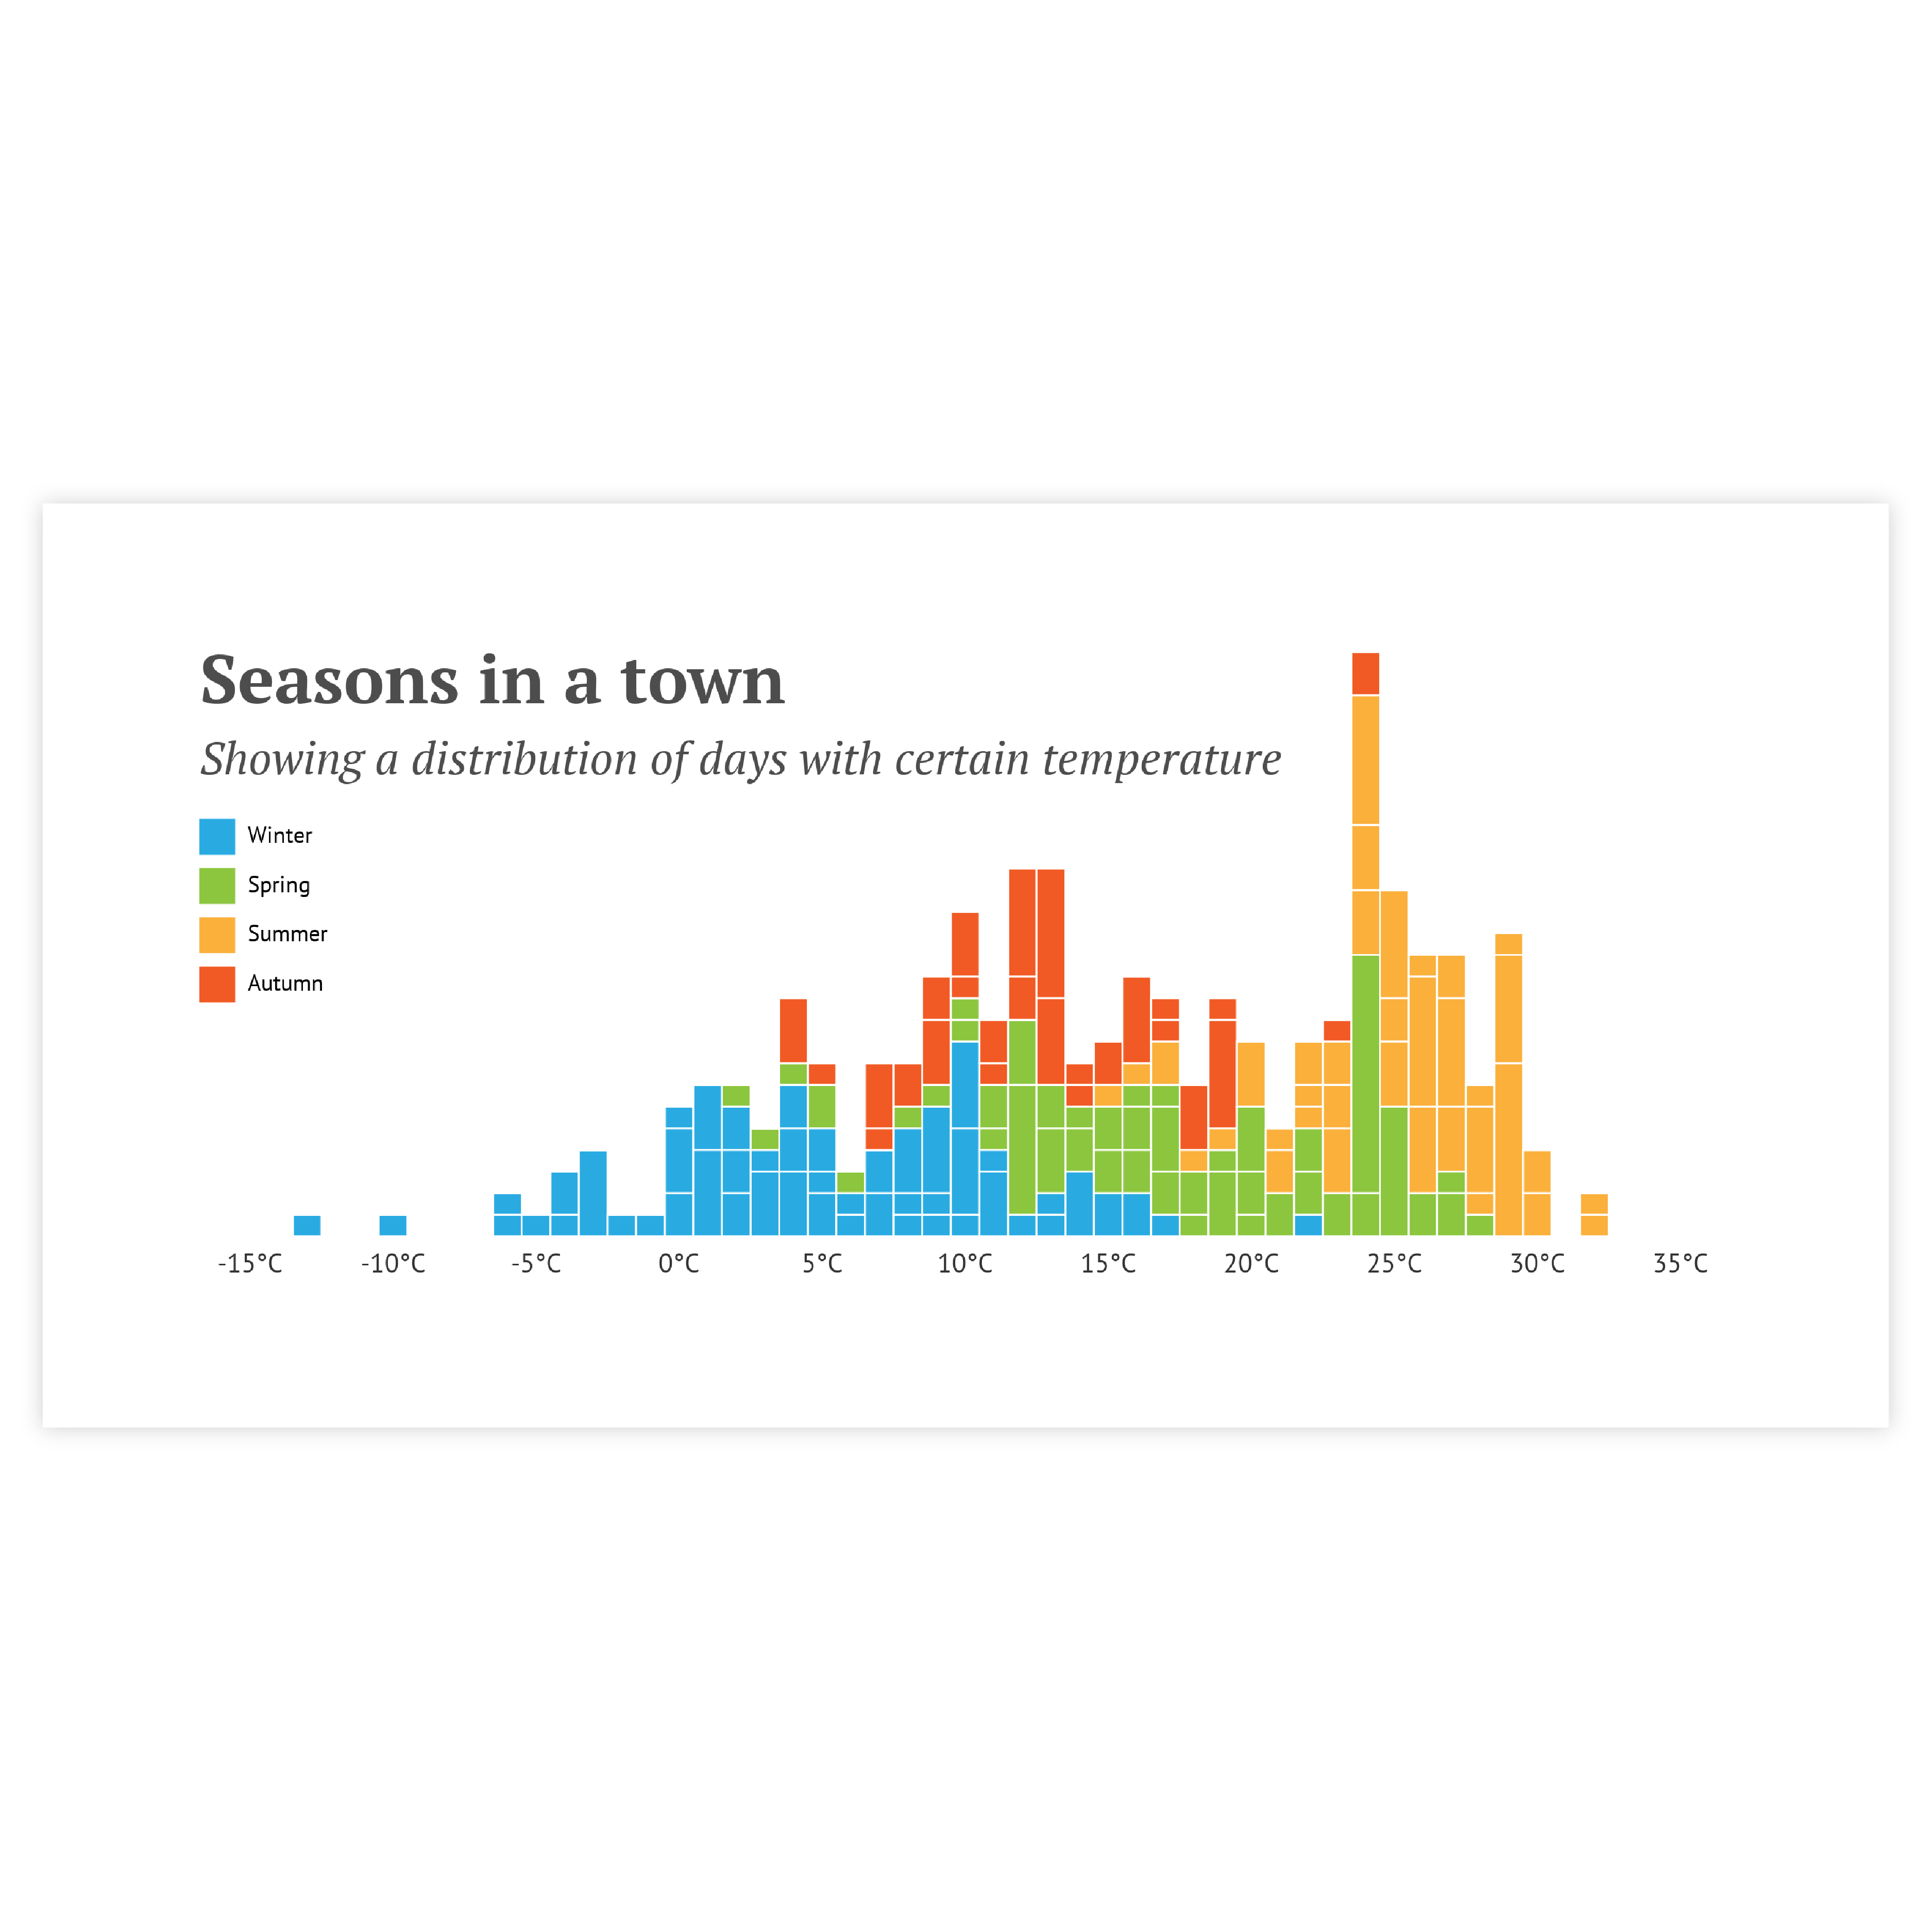
Histograms are quite often chosen as the first option to review the data. They allow us to quickly see the form of distribution.
Histogram examples & inspiration
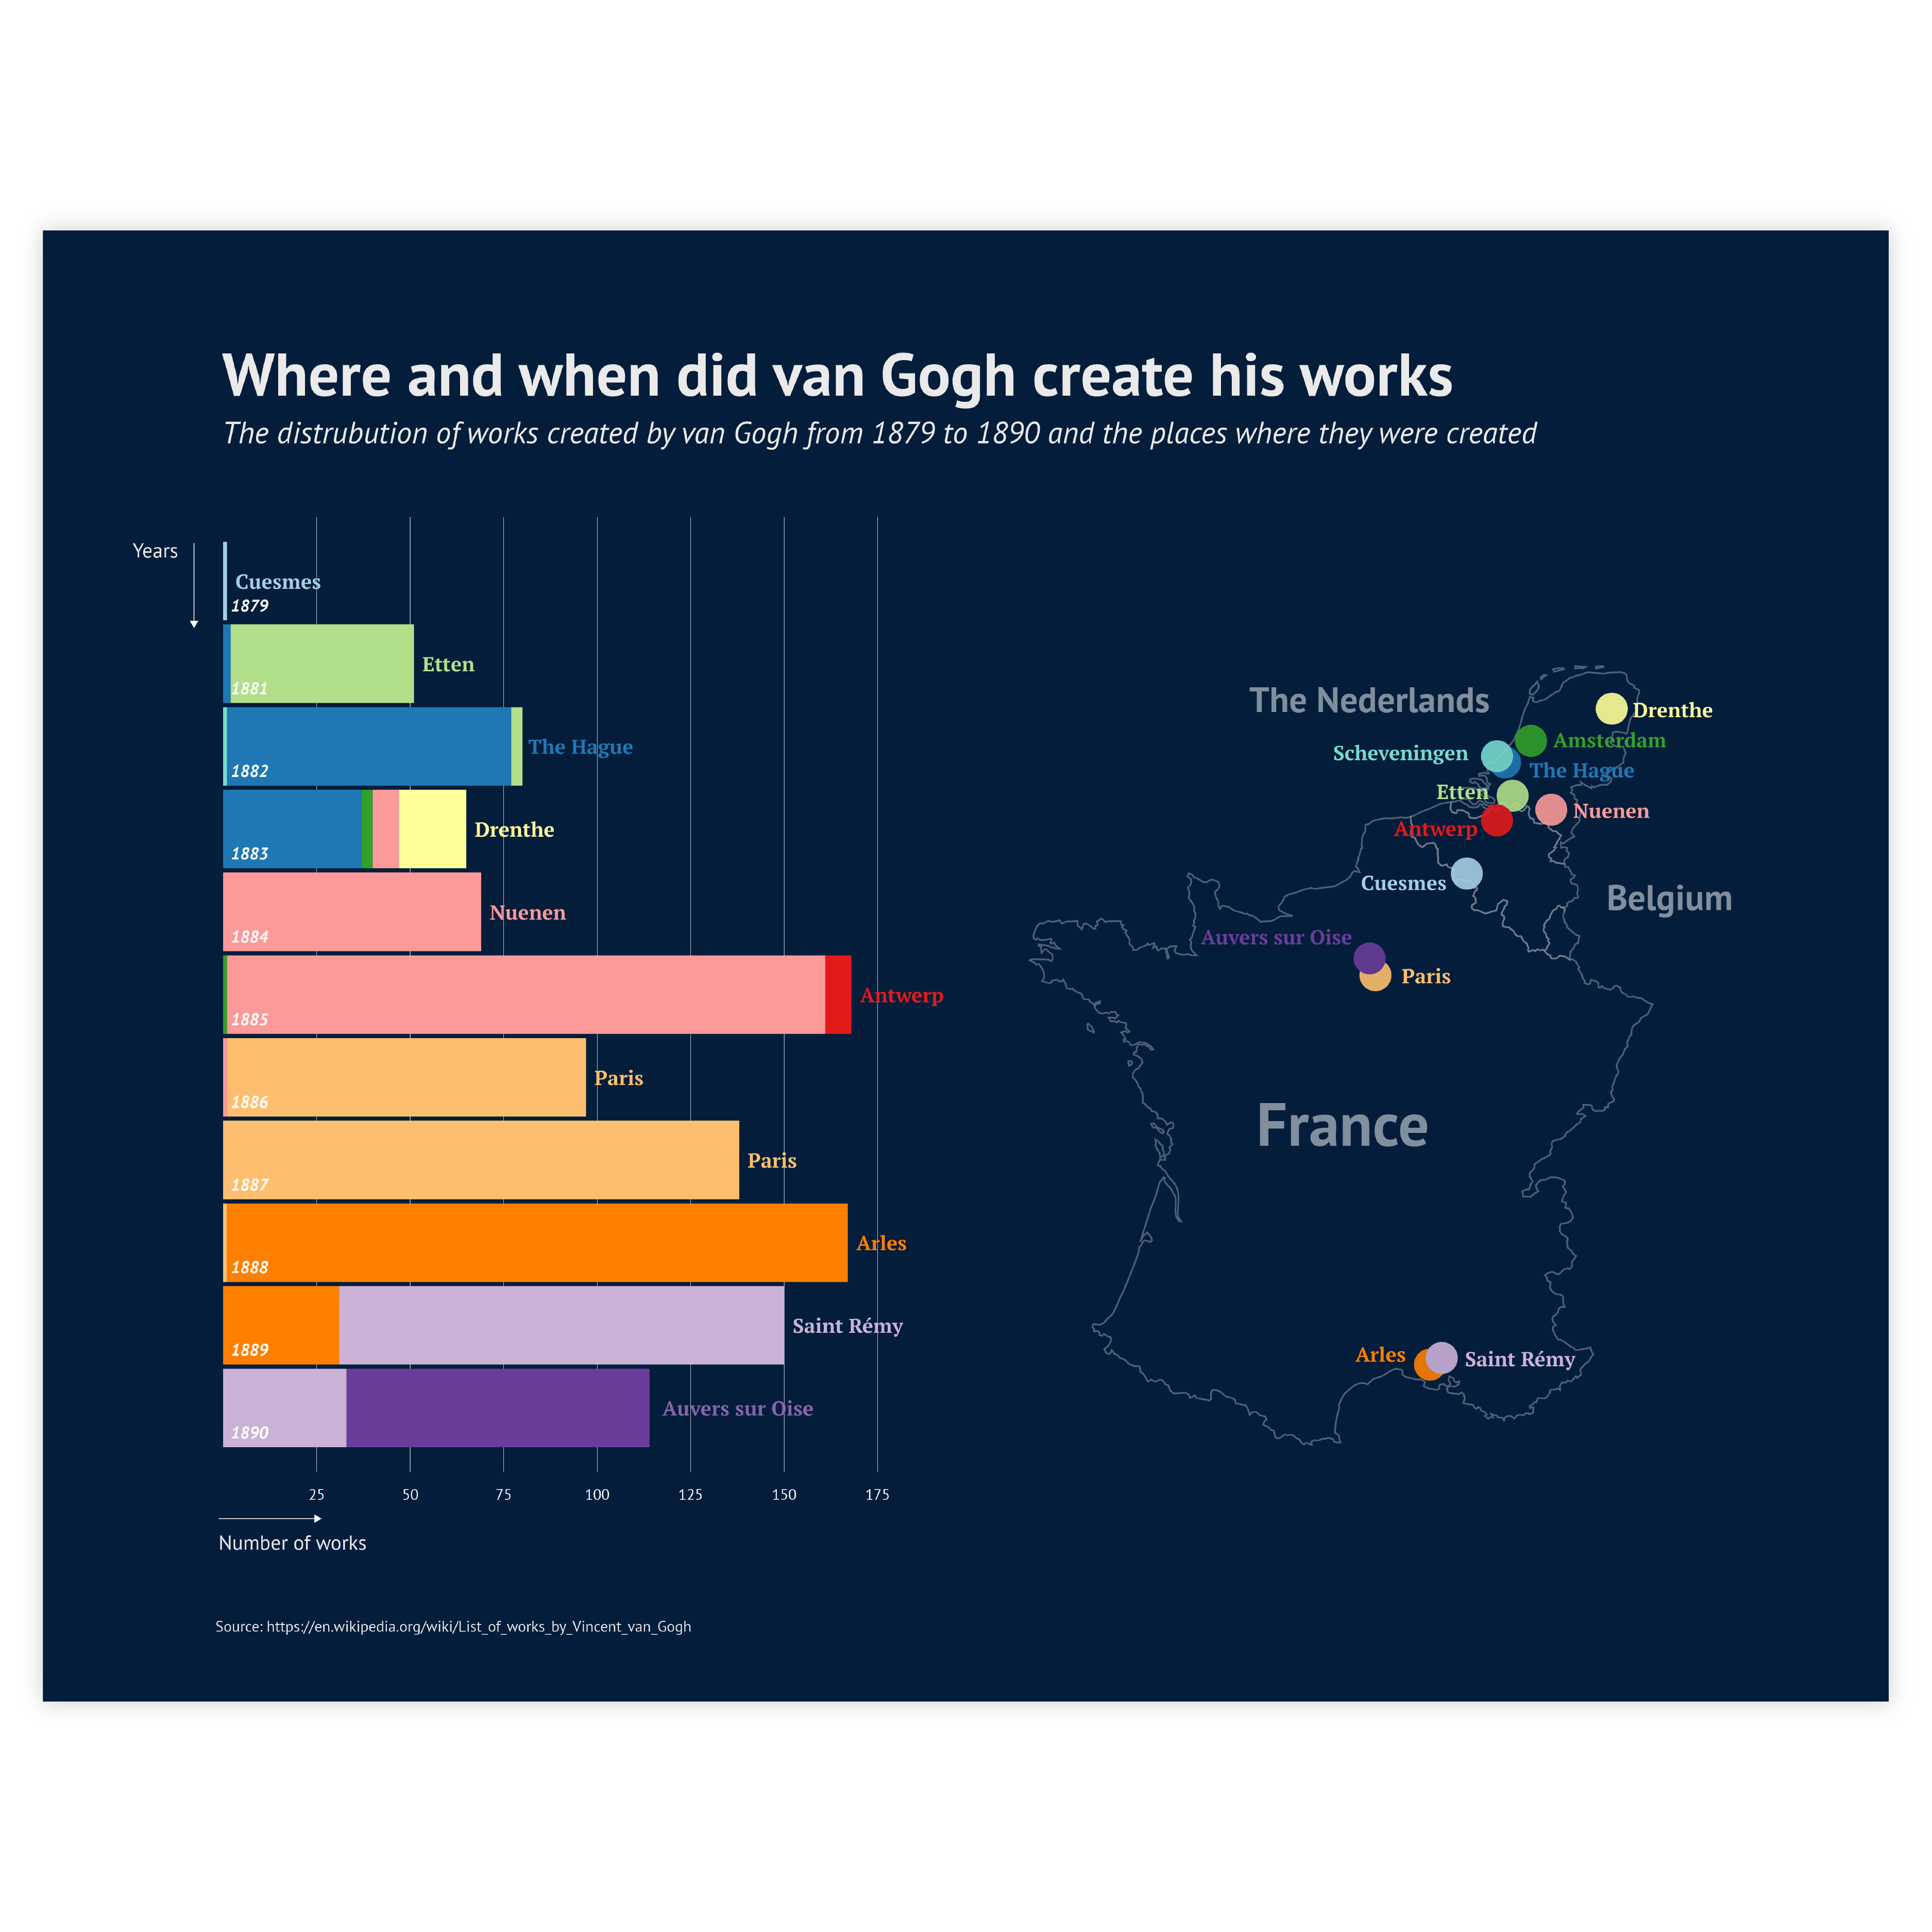
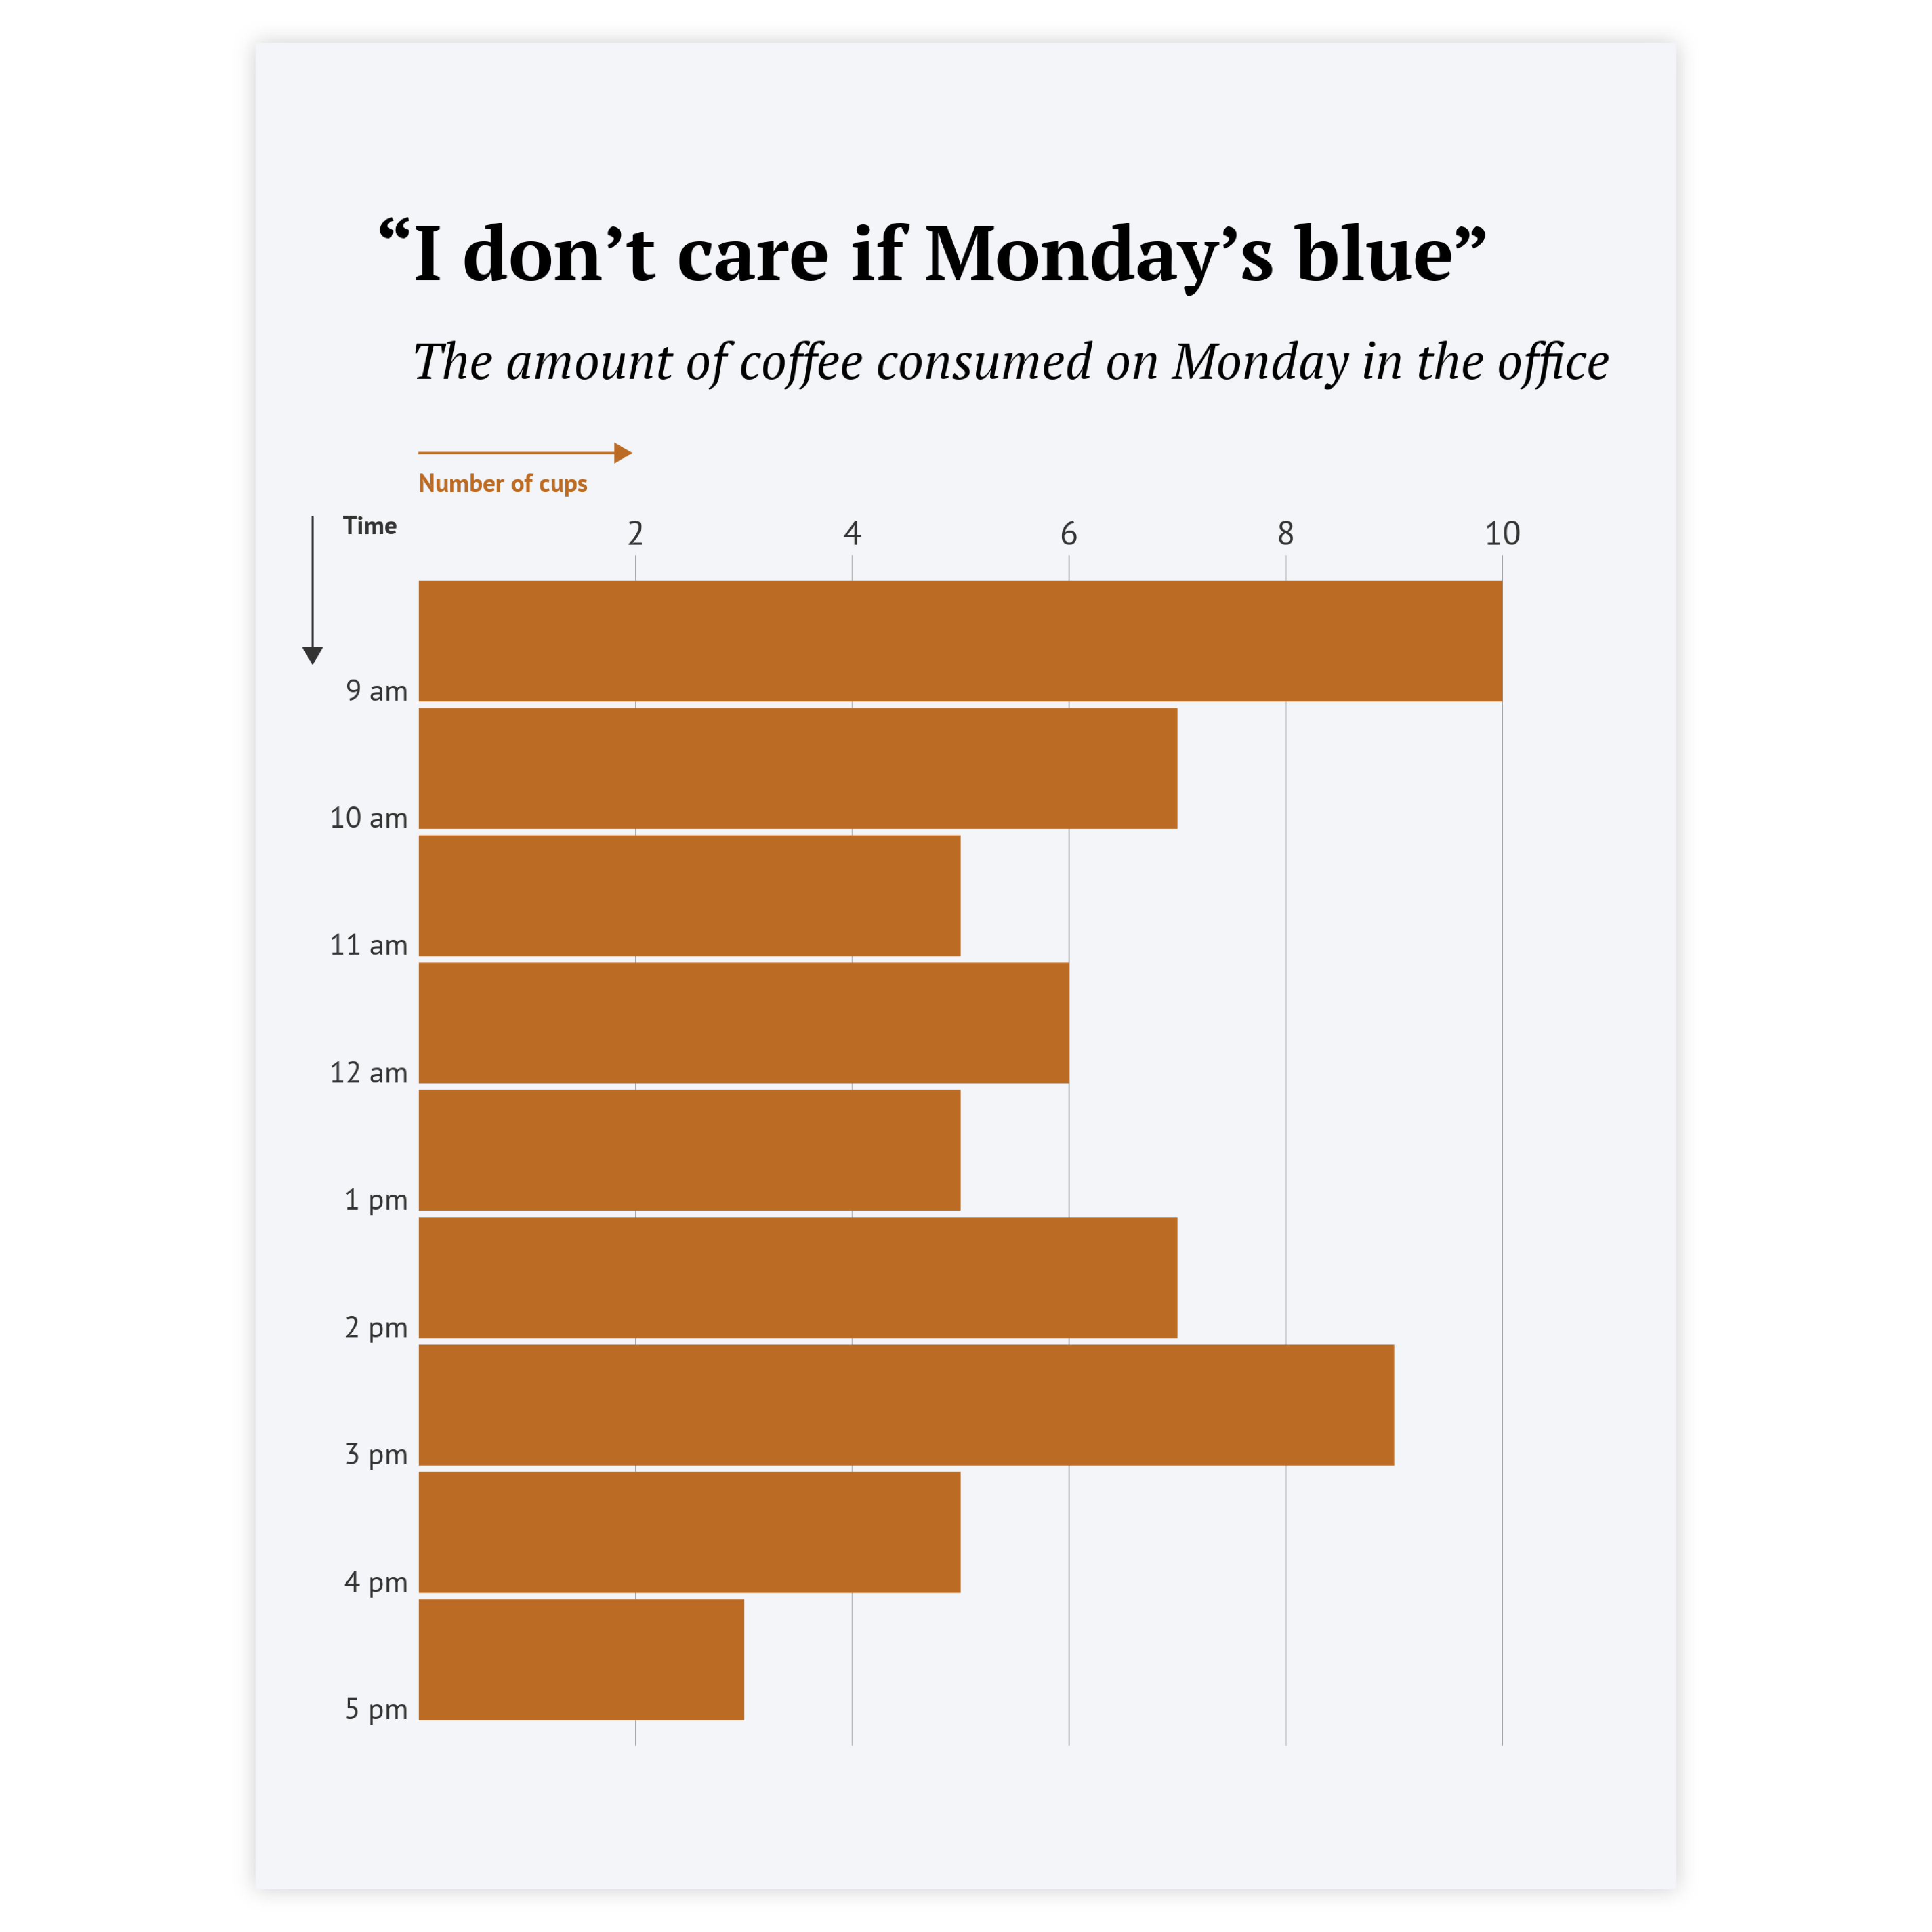
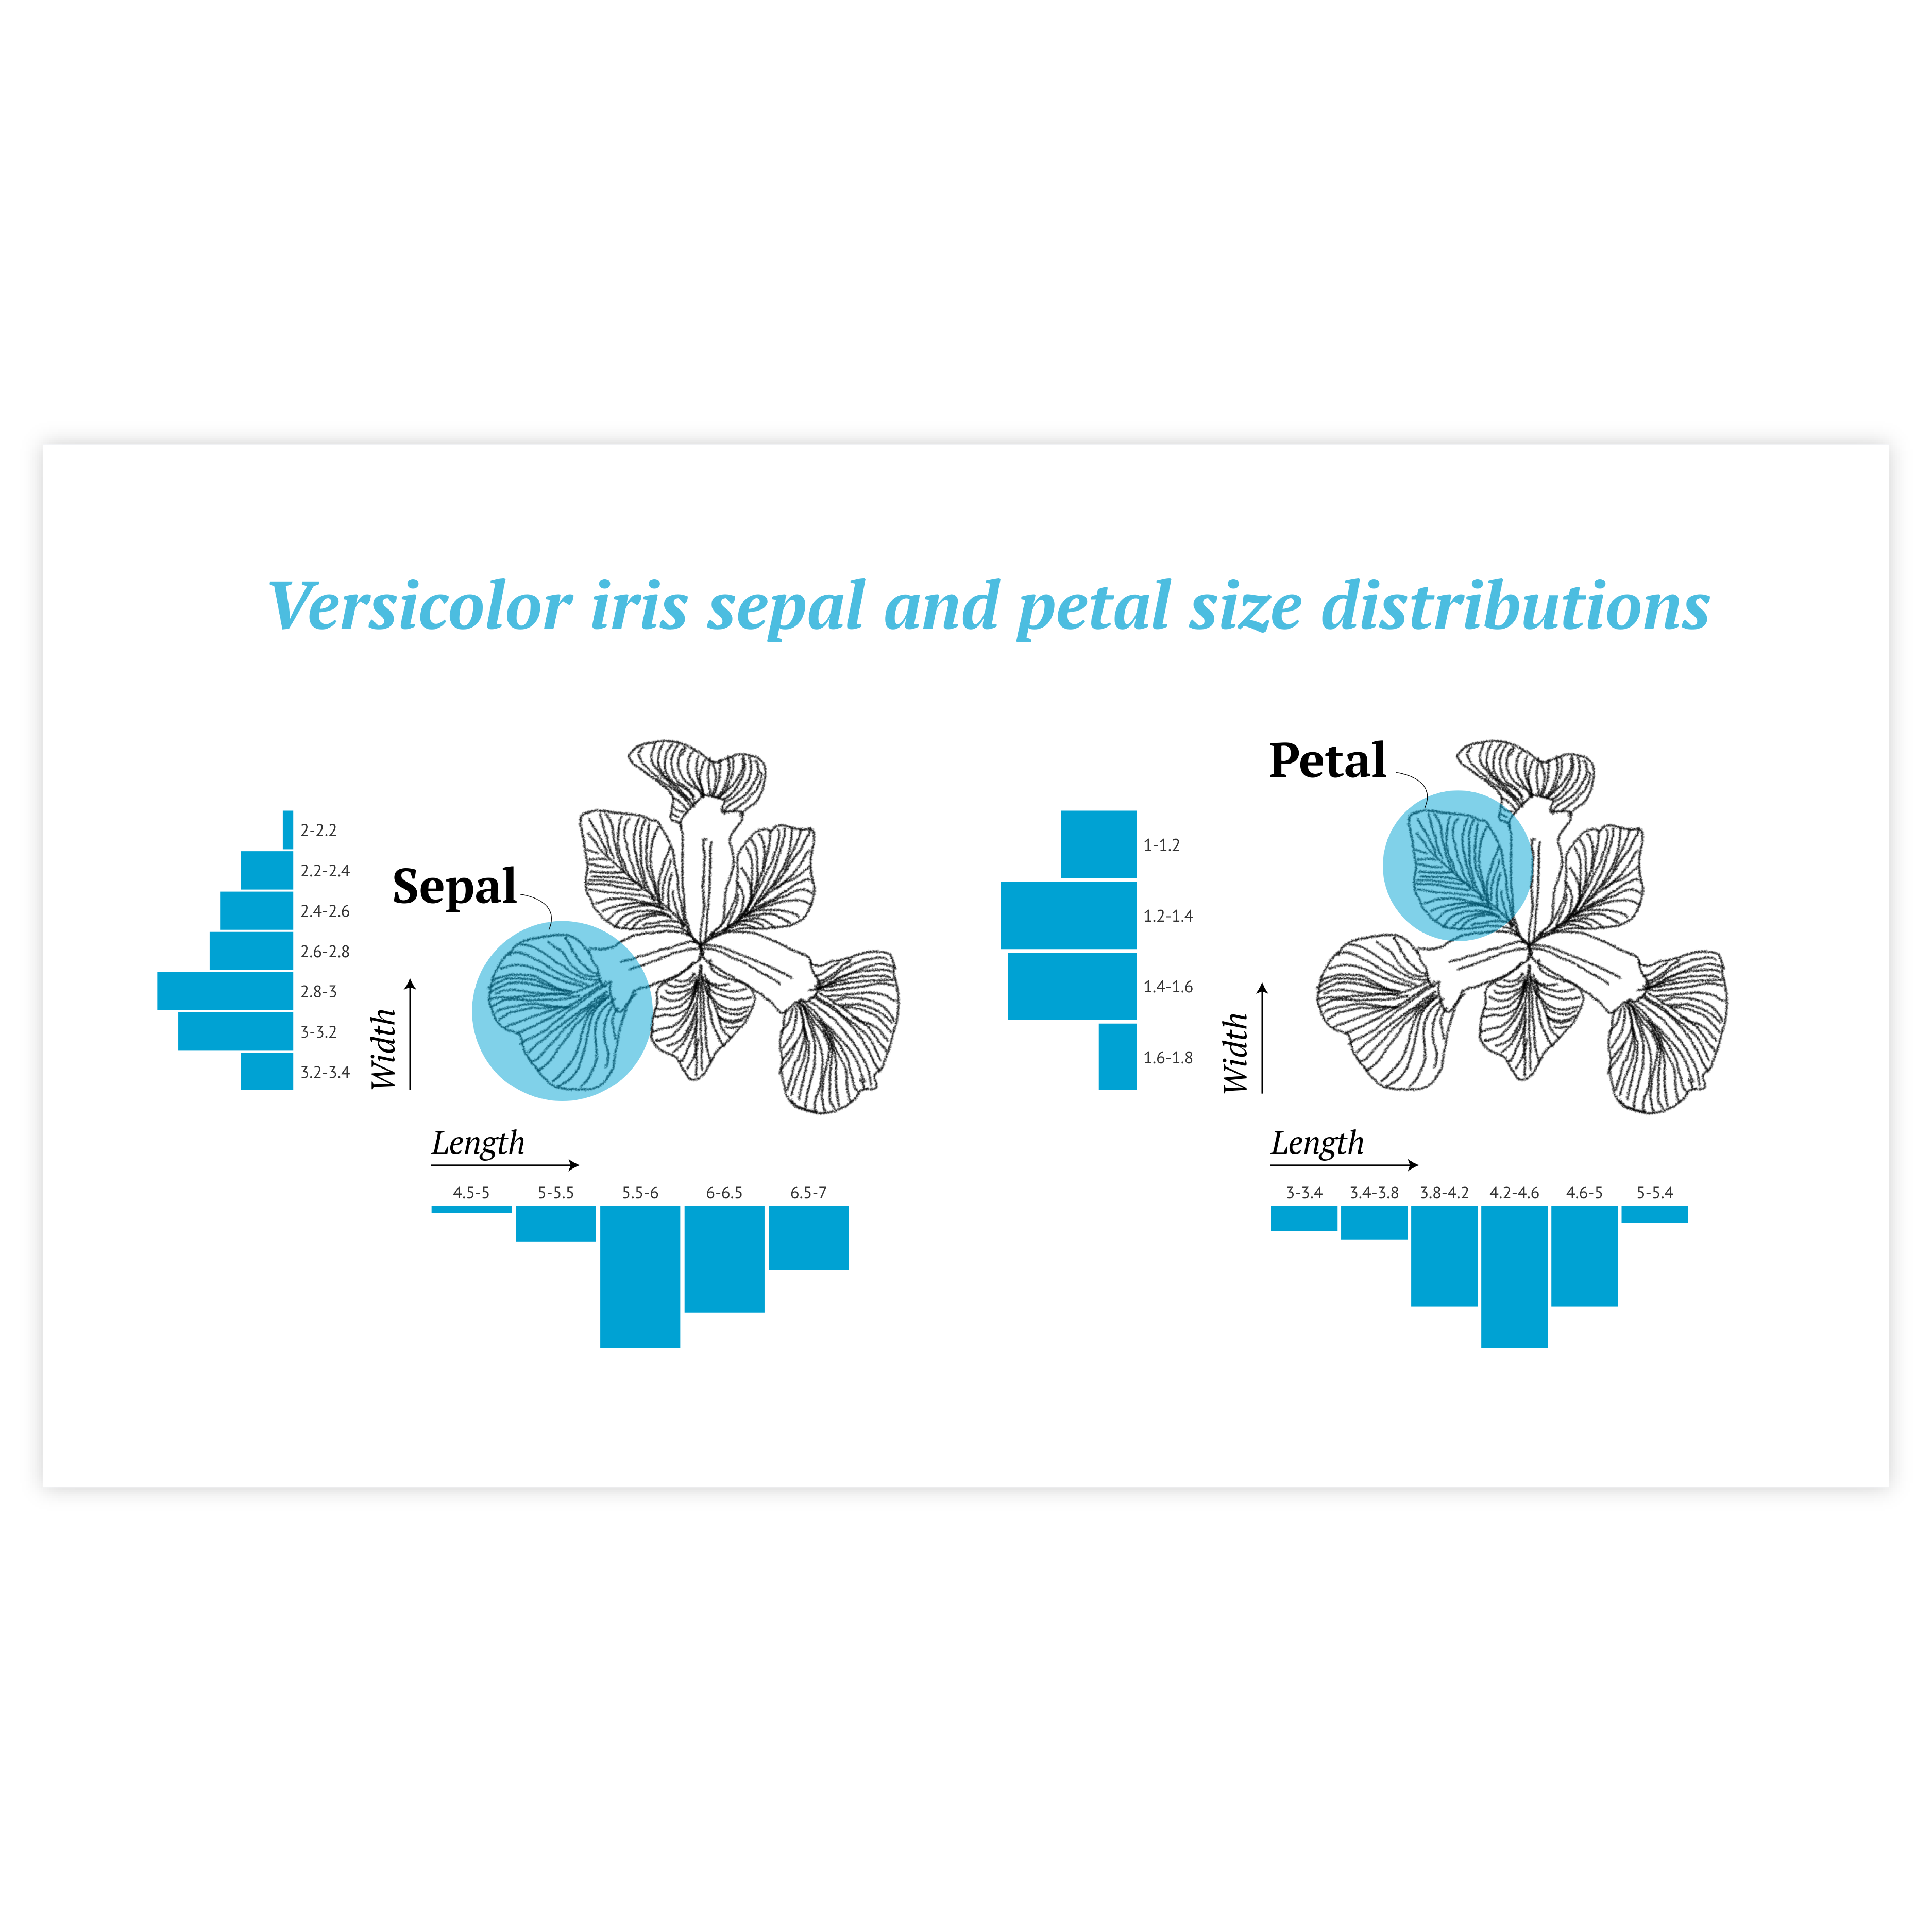
Scroll and click on the images below to find inspiration samples of histograms. With your Datylon account, you can use these designs, customize them and update them with new data. Or start designing your very own histogram!
Variations of a histogram
The charts below are variations of a histogram. To learn how to make them with Datylon, check out the bar chart user documentation in the Datylon Help Center.
Alternatives to a histogram
Substitute your histogram with the charts below when you want an alternative representation of the data distribution.
Pro tips for designing a histogram
Learn how to improve the readability and visual appeal of your histogram.
Bin sizing
The size of the bin is the ultimate customizable option for a histogram, depending on the size of the bin the form of the histogram can be changed drastically. It’s better to follow your data’s logic, but there’s also a popular way for choosing a bin size called Sturge’s rule. It’s used in all major software, but it was criticized for over-smoothing histograms.
The formula is the following: K=1+3.322 log(n),
where:
K is the number of bins
n is the number of observations in a dataset.
Labeling
In most cases, the histogram is used to see the form of distribution and overall pattern, so there’s no need for detailed labeling of every bar. A regular axis label for both axes should work.
Read moreColoring
Coloring of histograms follows the general rule of using color in data visualization – use color only if it communicates additional information. For any basic histogram, one color should be enough.
Read moreHighlighting
To draw attention to the most important bin(s) of a histogram, a good solution is to highlight these bin bars and color all the others – in a neutral color. Our brain is programmed to notice deviations instantly. This can be done, for example, by applying changes in size, movement, or color. This way, highlighting a specific bin will help catch the reader’s eye immediately.
Read more
