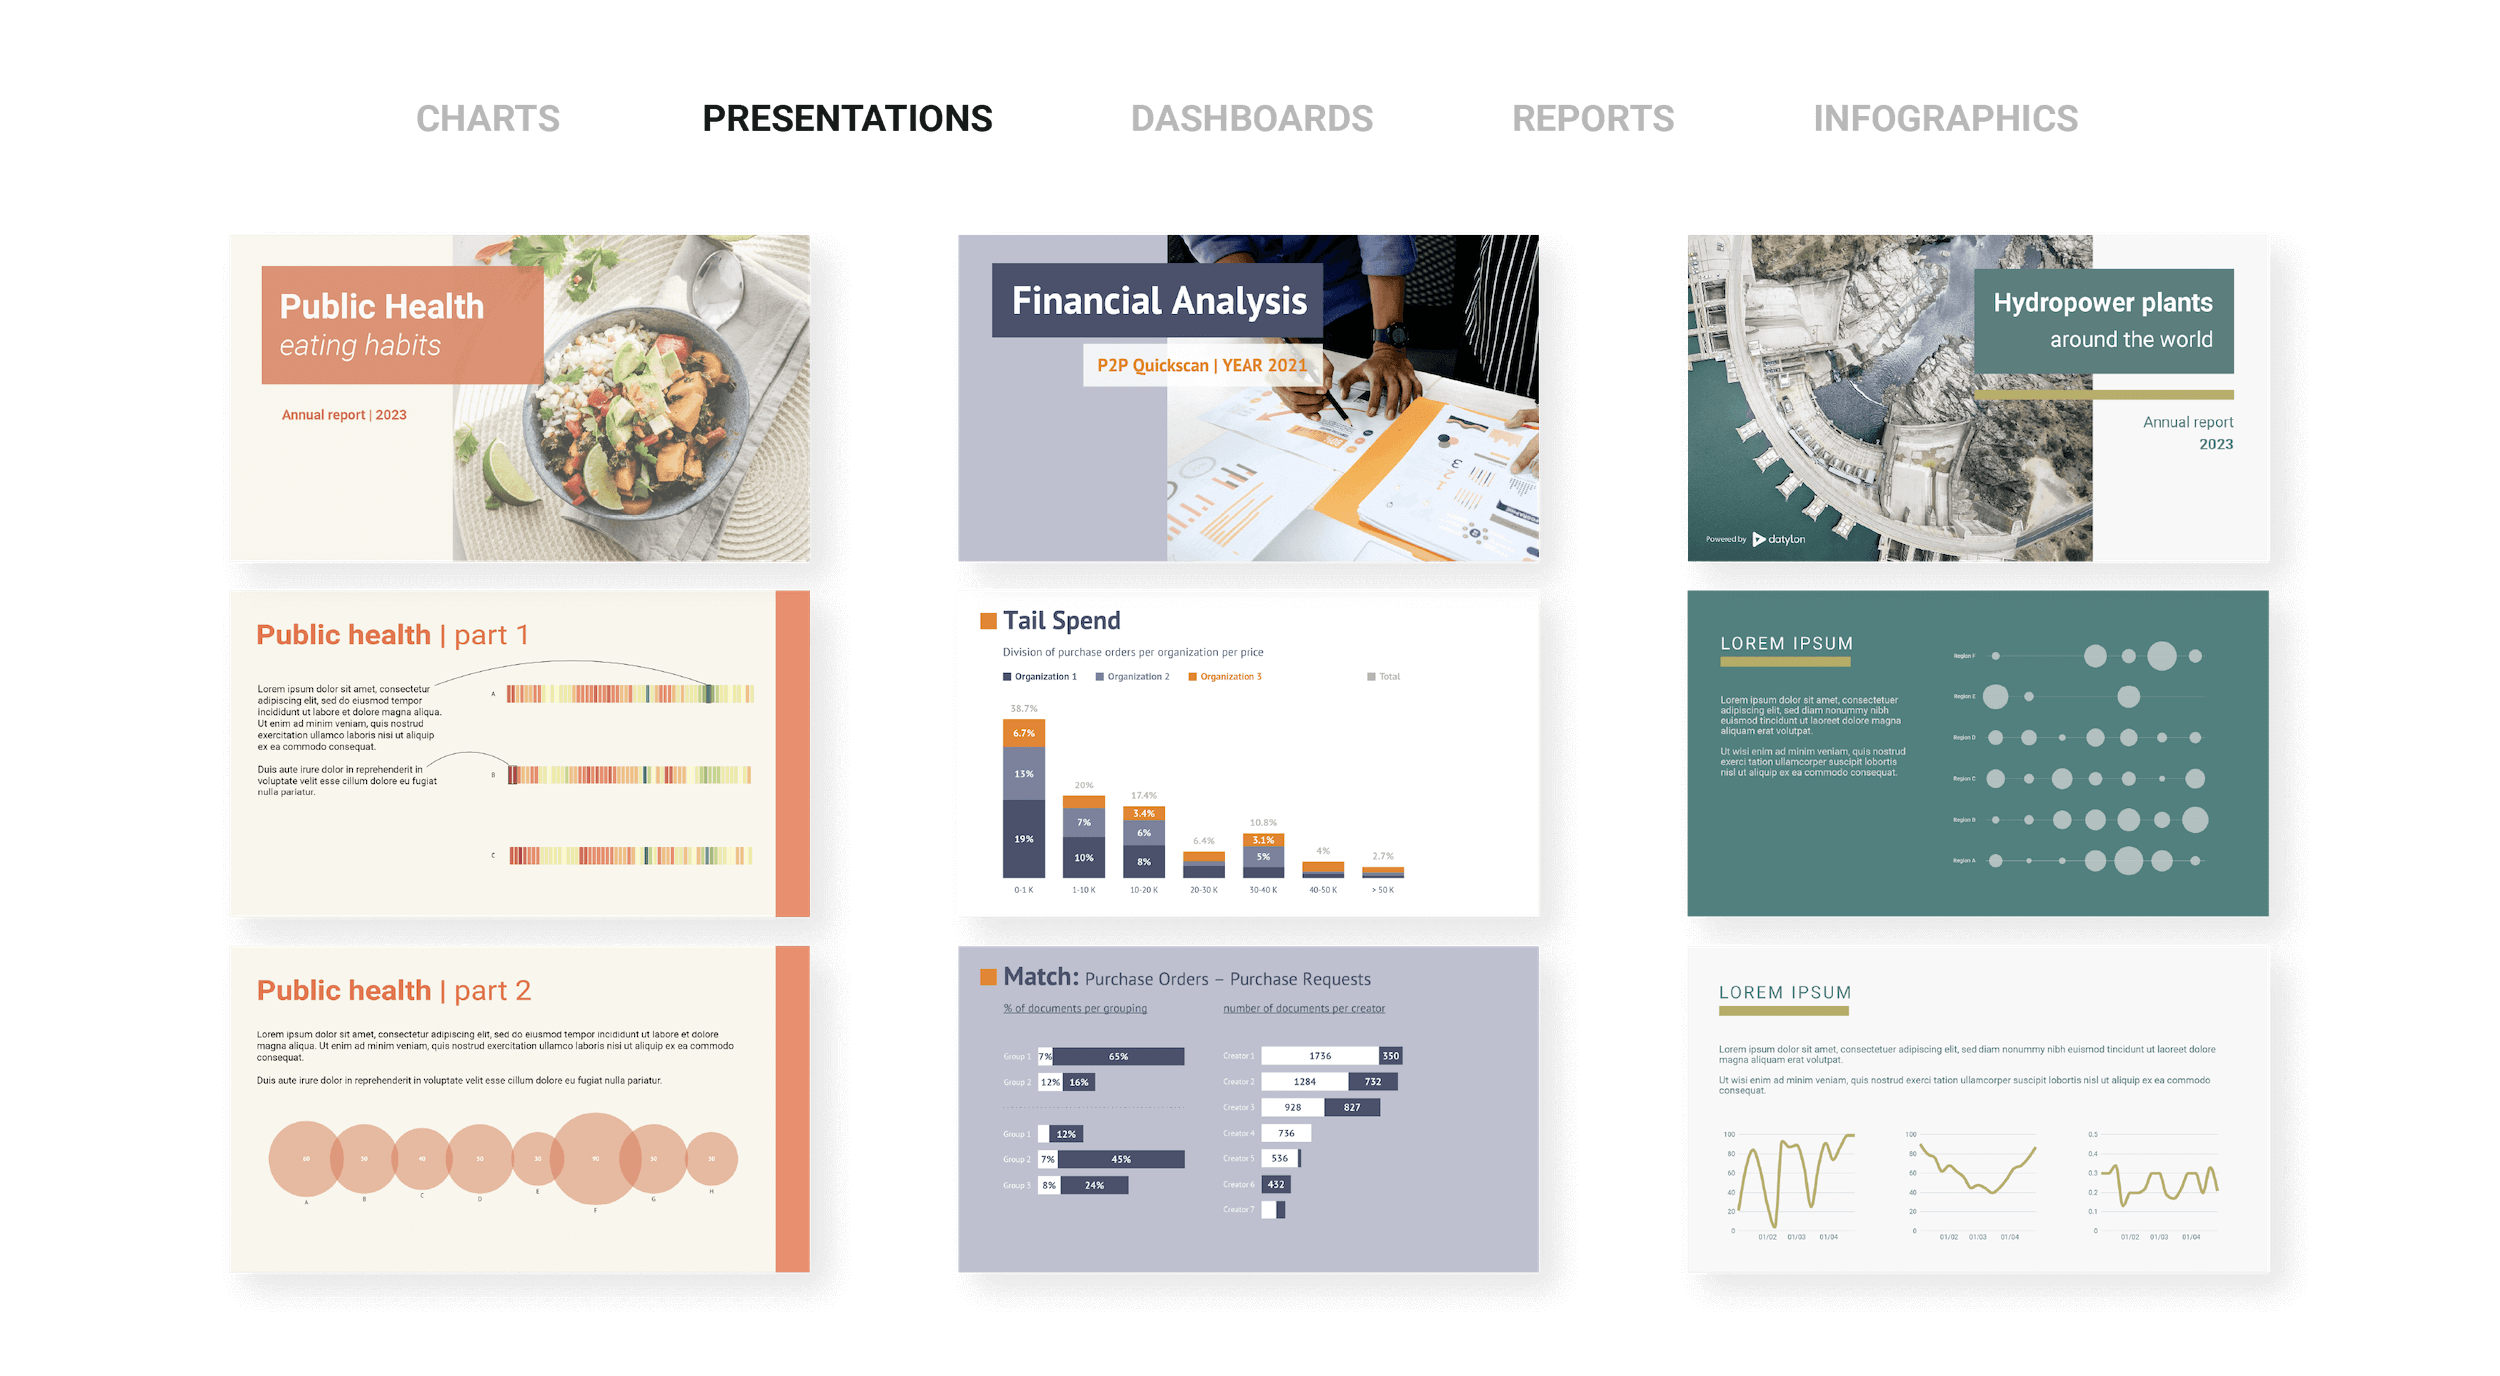

Embrace data-driven storytelling
Turn raw data into engaging narratives. Datylon for PowerPoint empowers you to create captivating visual stories that resonate with your audience, making data-driven decisions easier than ever.
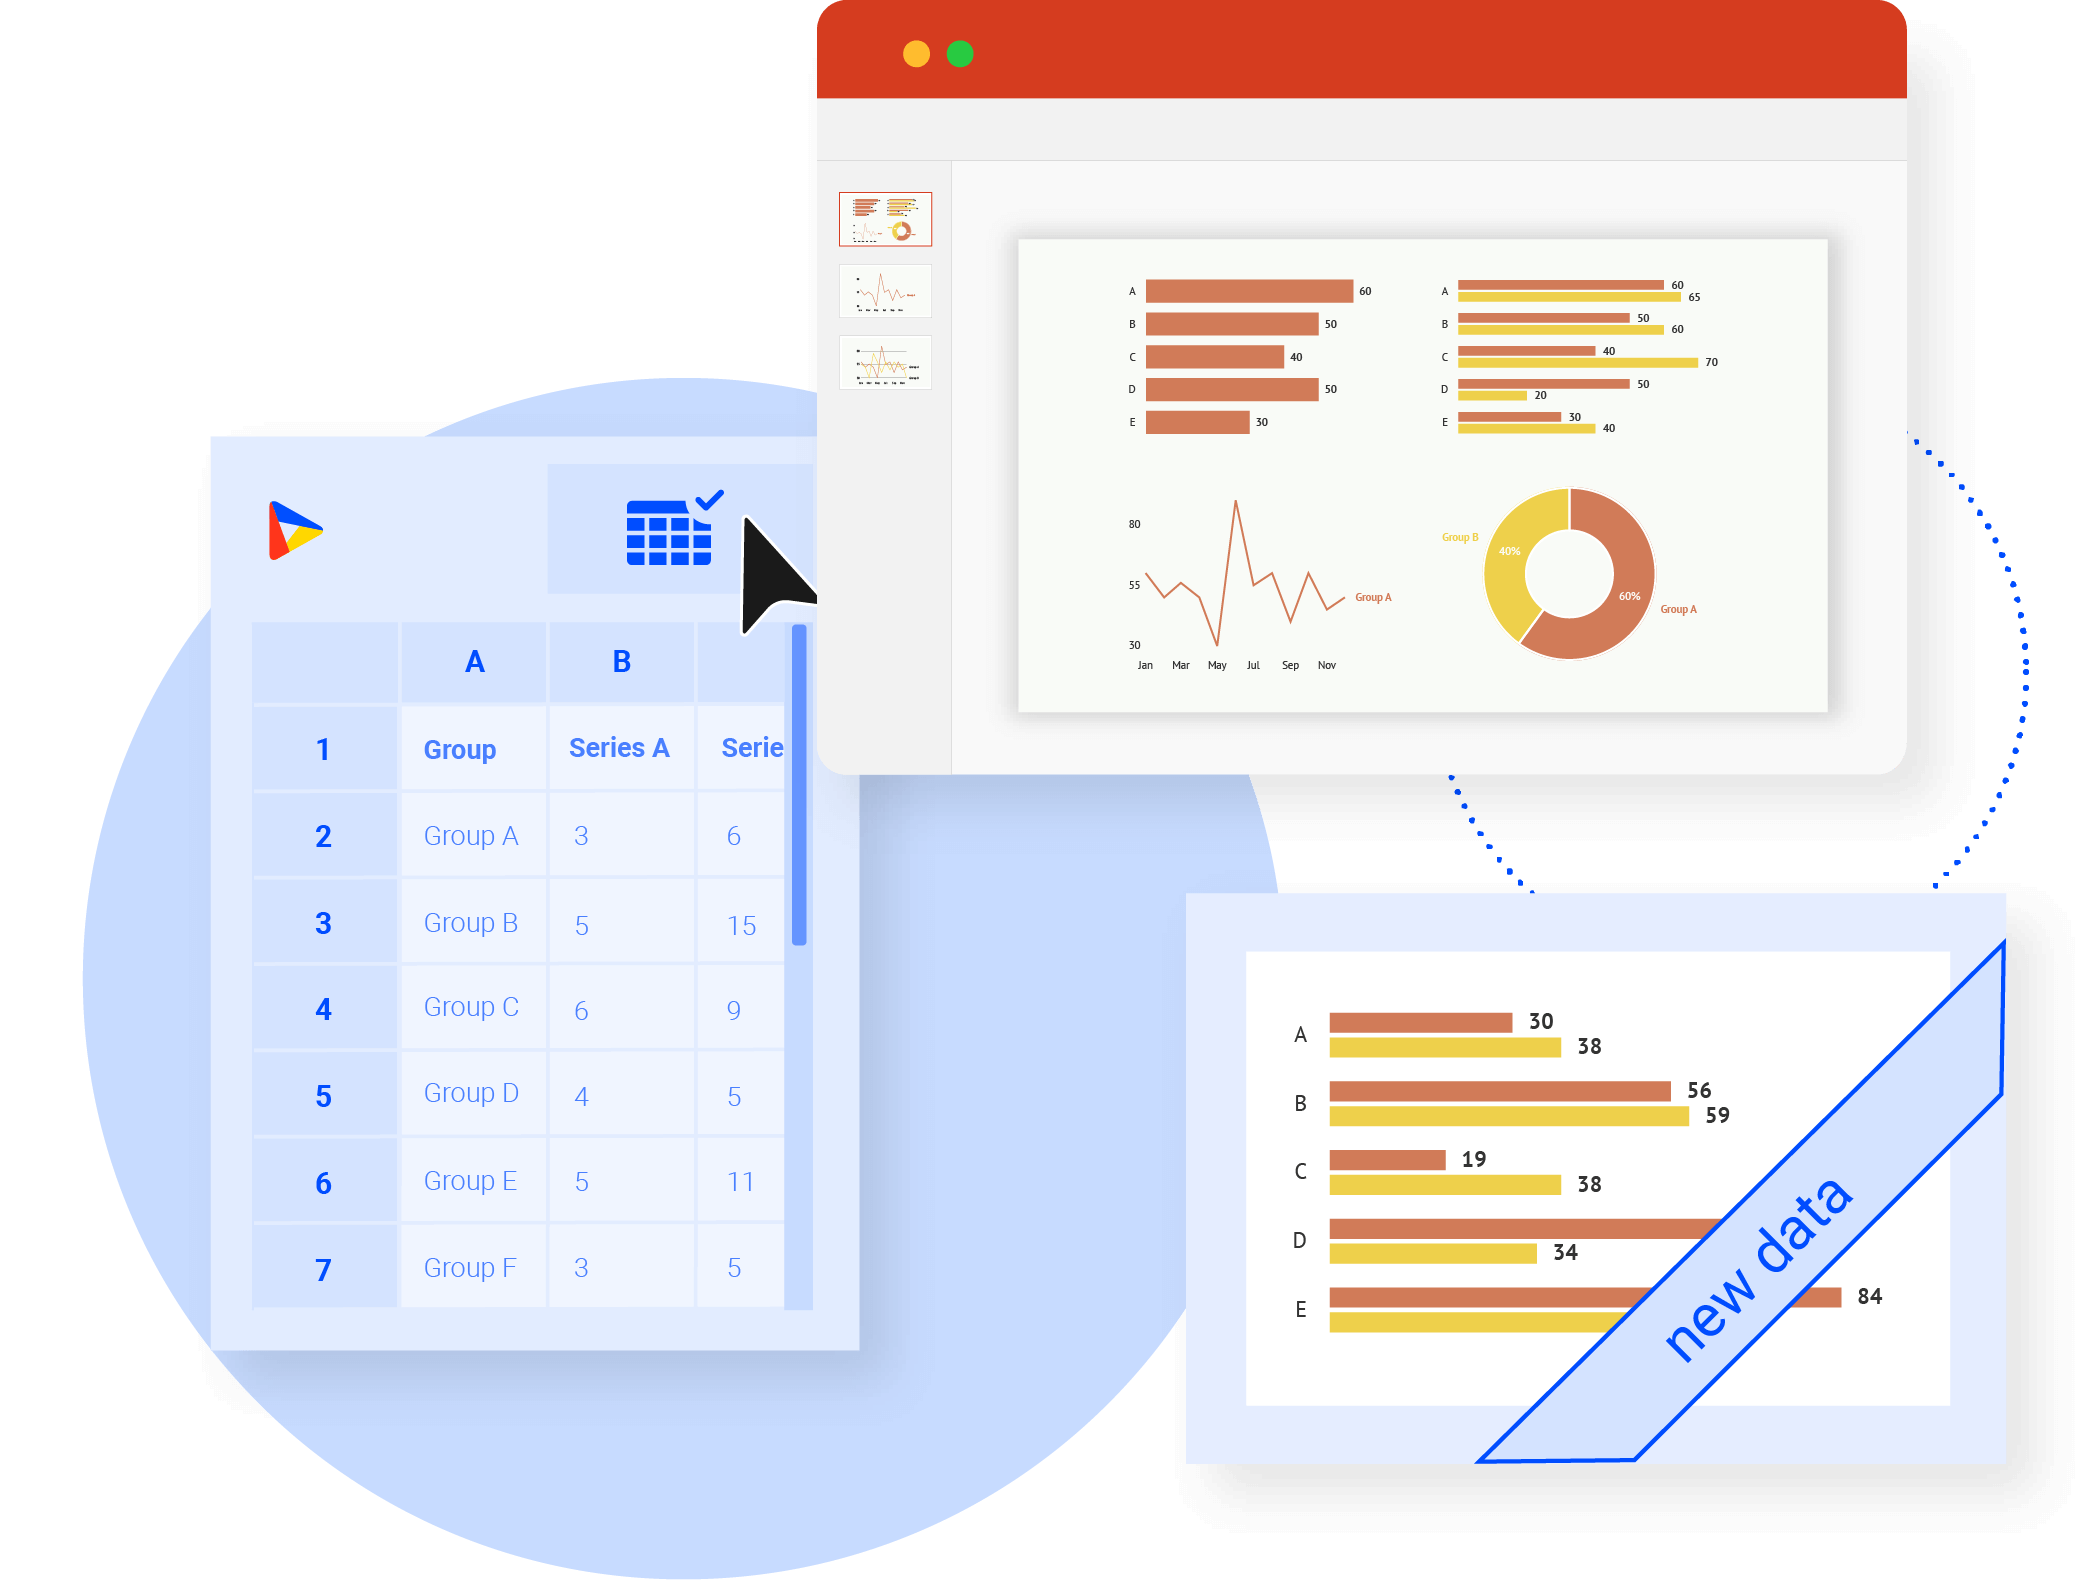
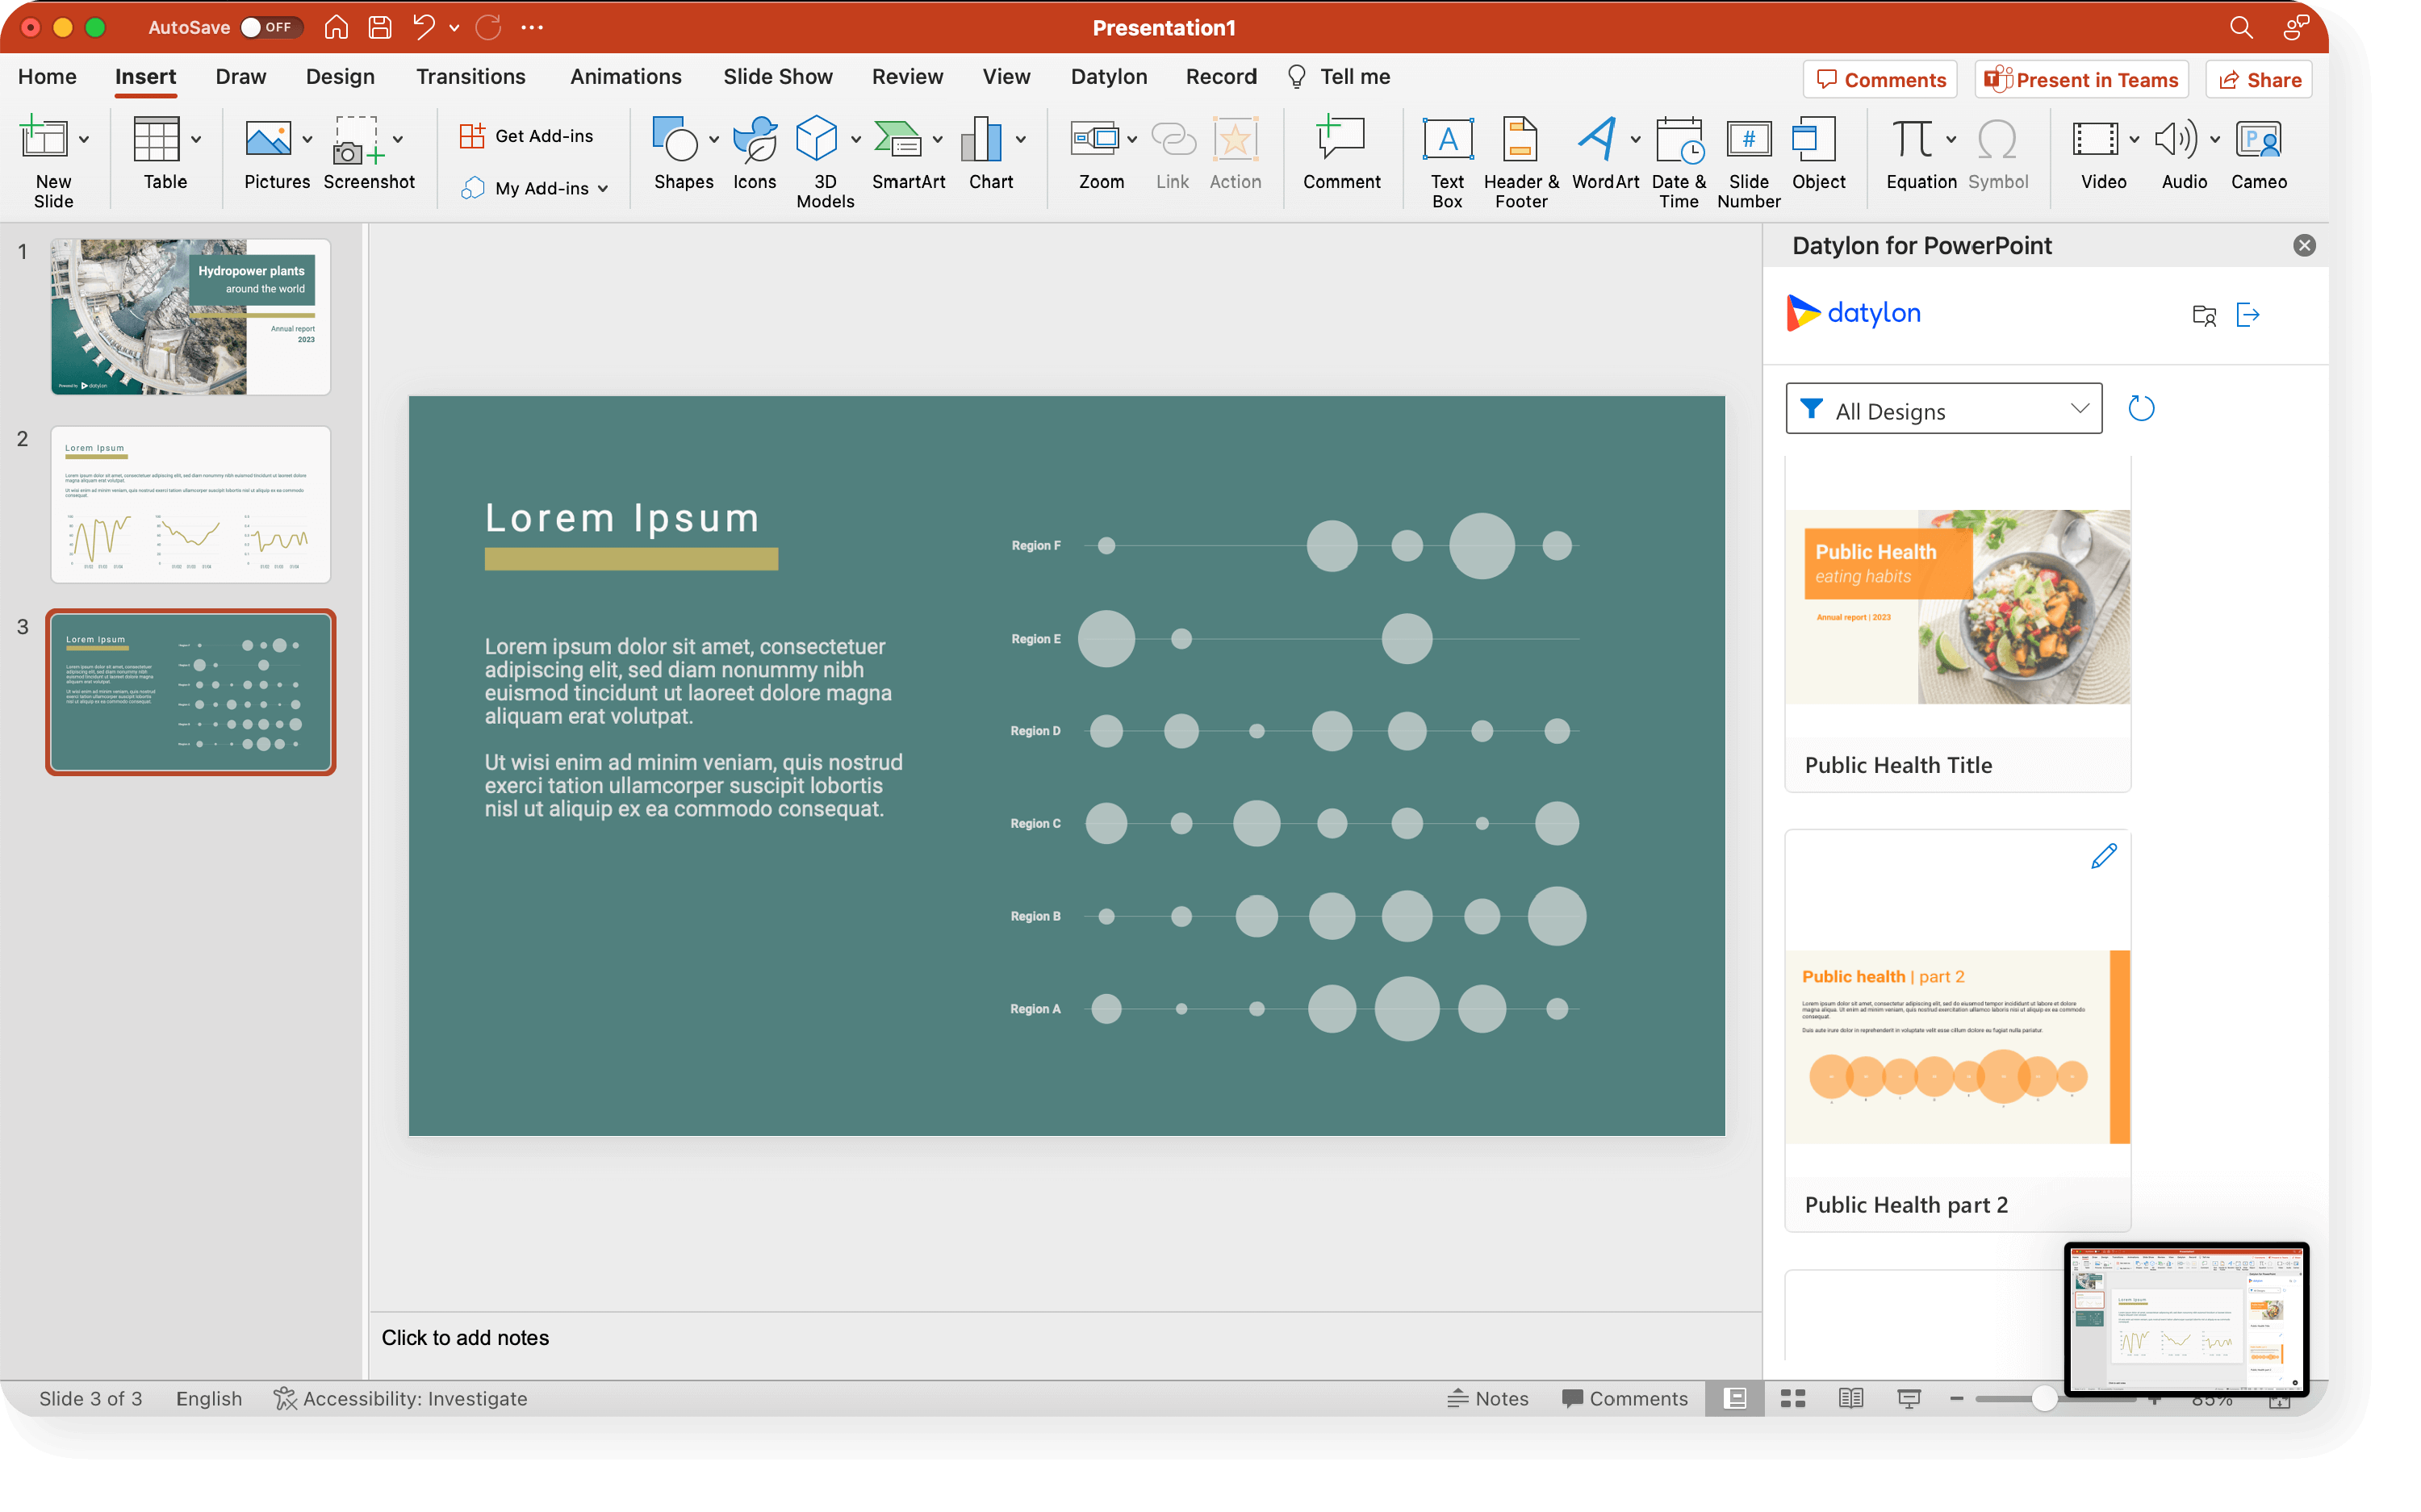
Save time, deliver insights
Save valuable time by updating all your charts across multiple slides with just a few clicks. Maintain accuracy and consistency, keeping your presentation up-to-date with minimal effort.
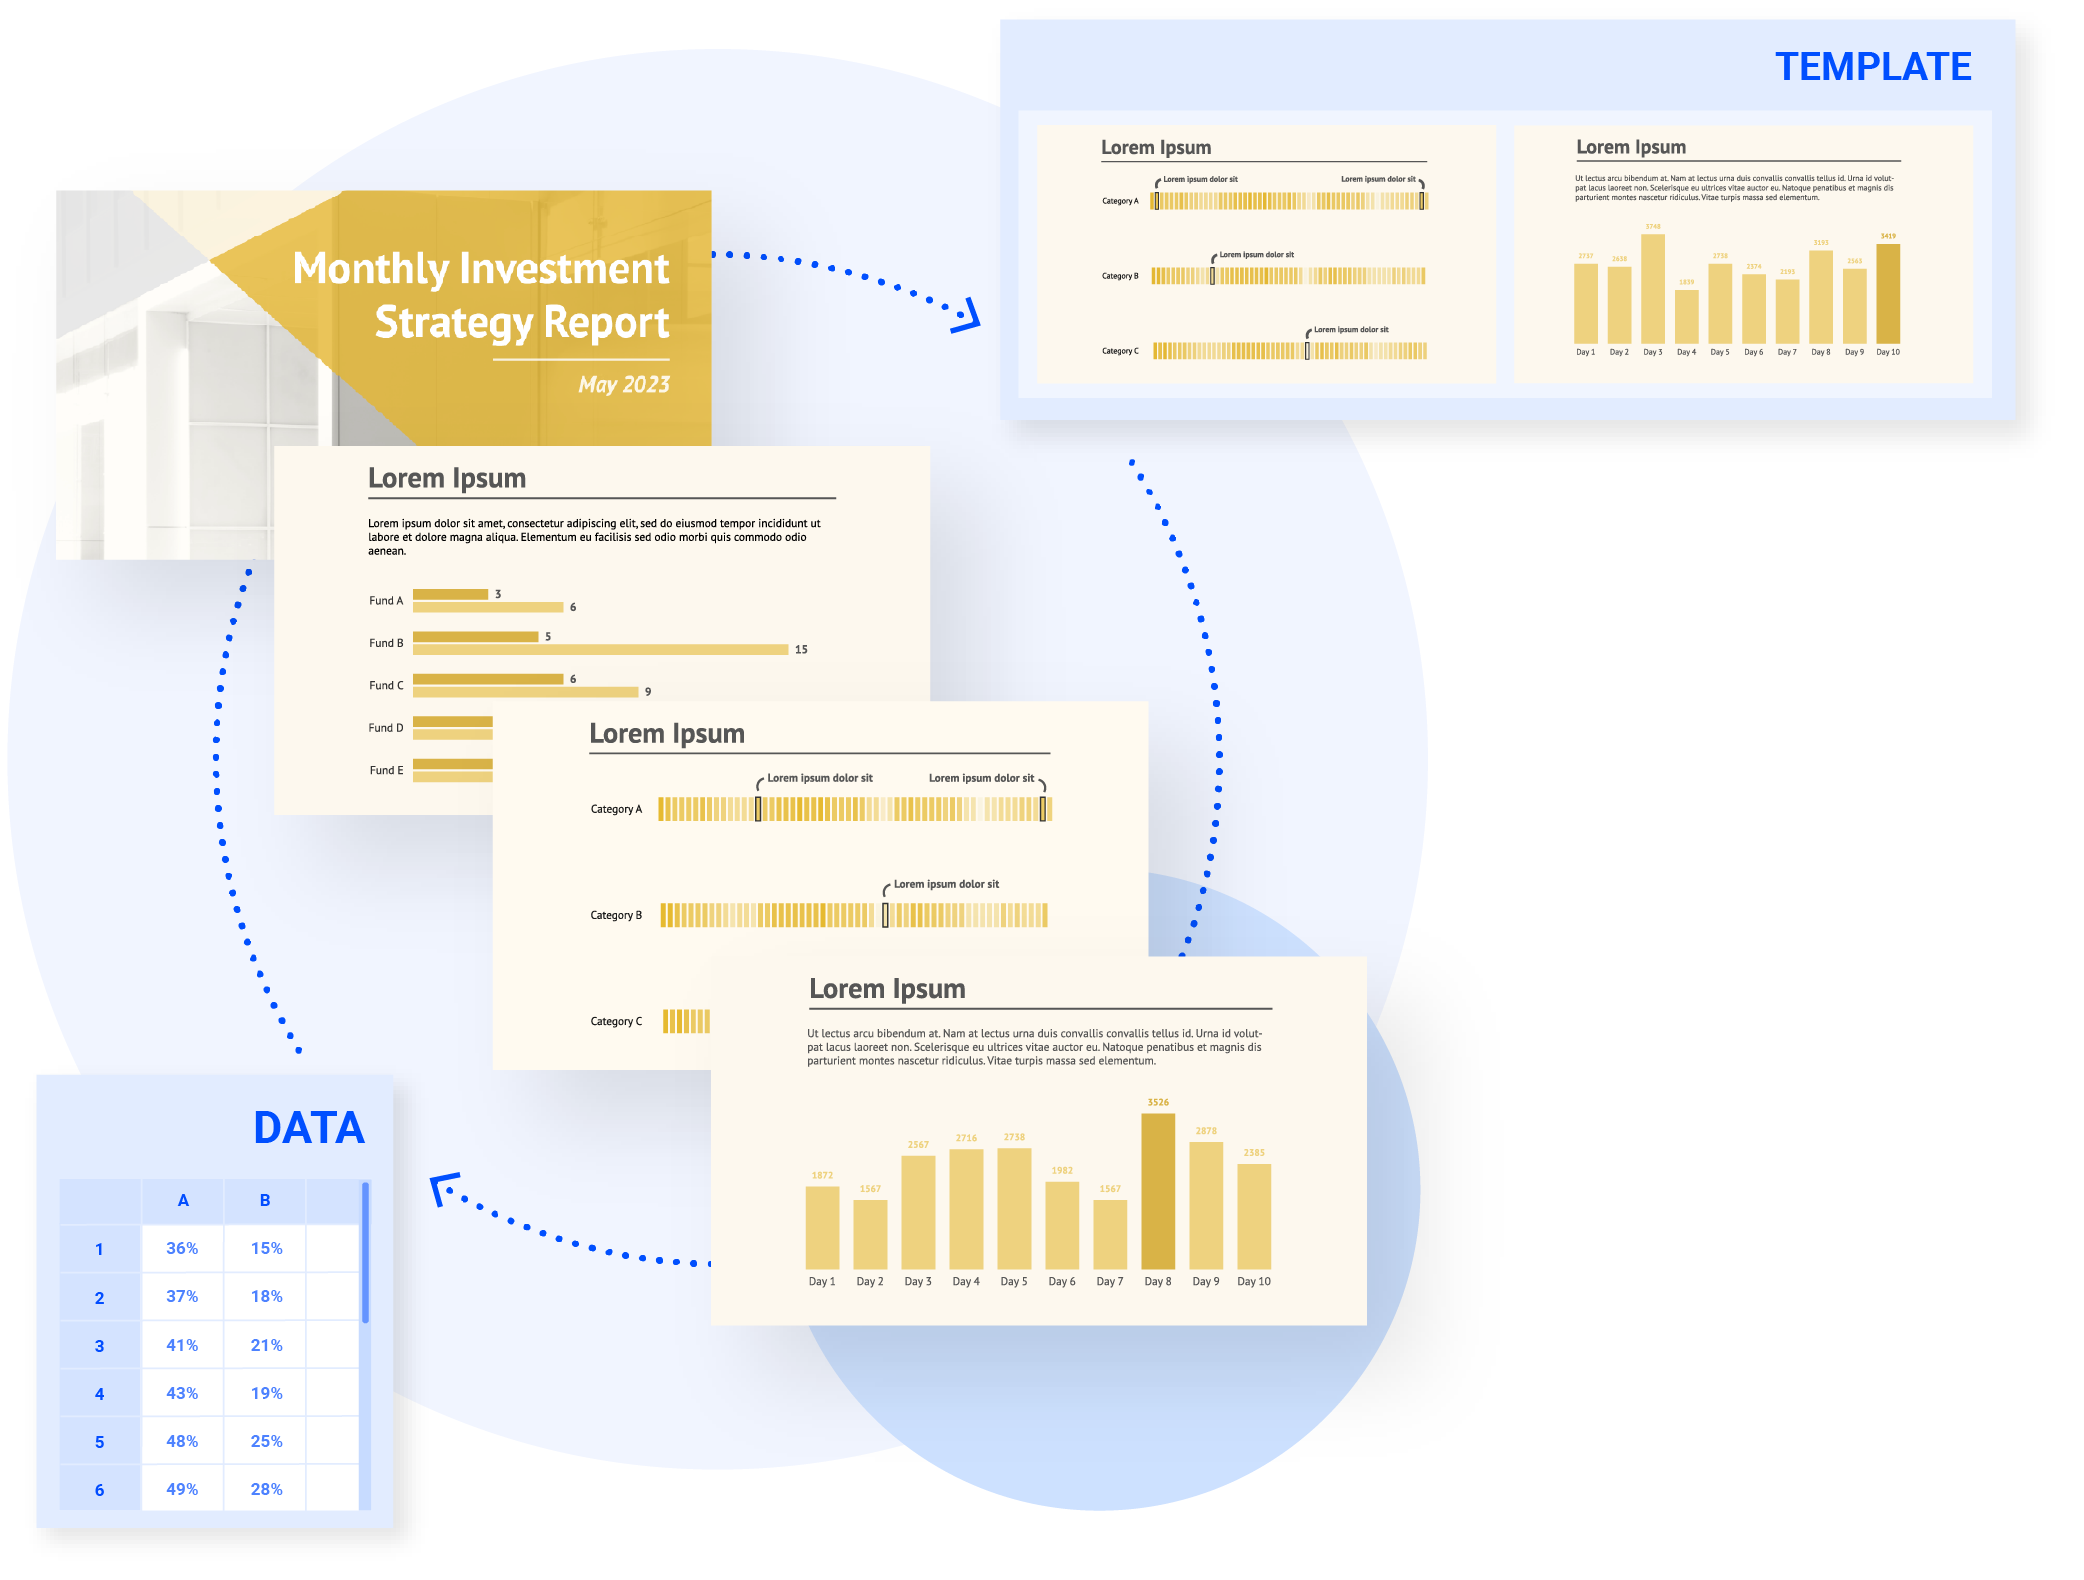
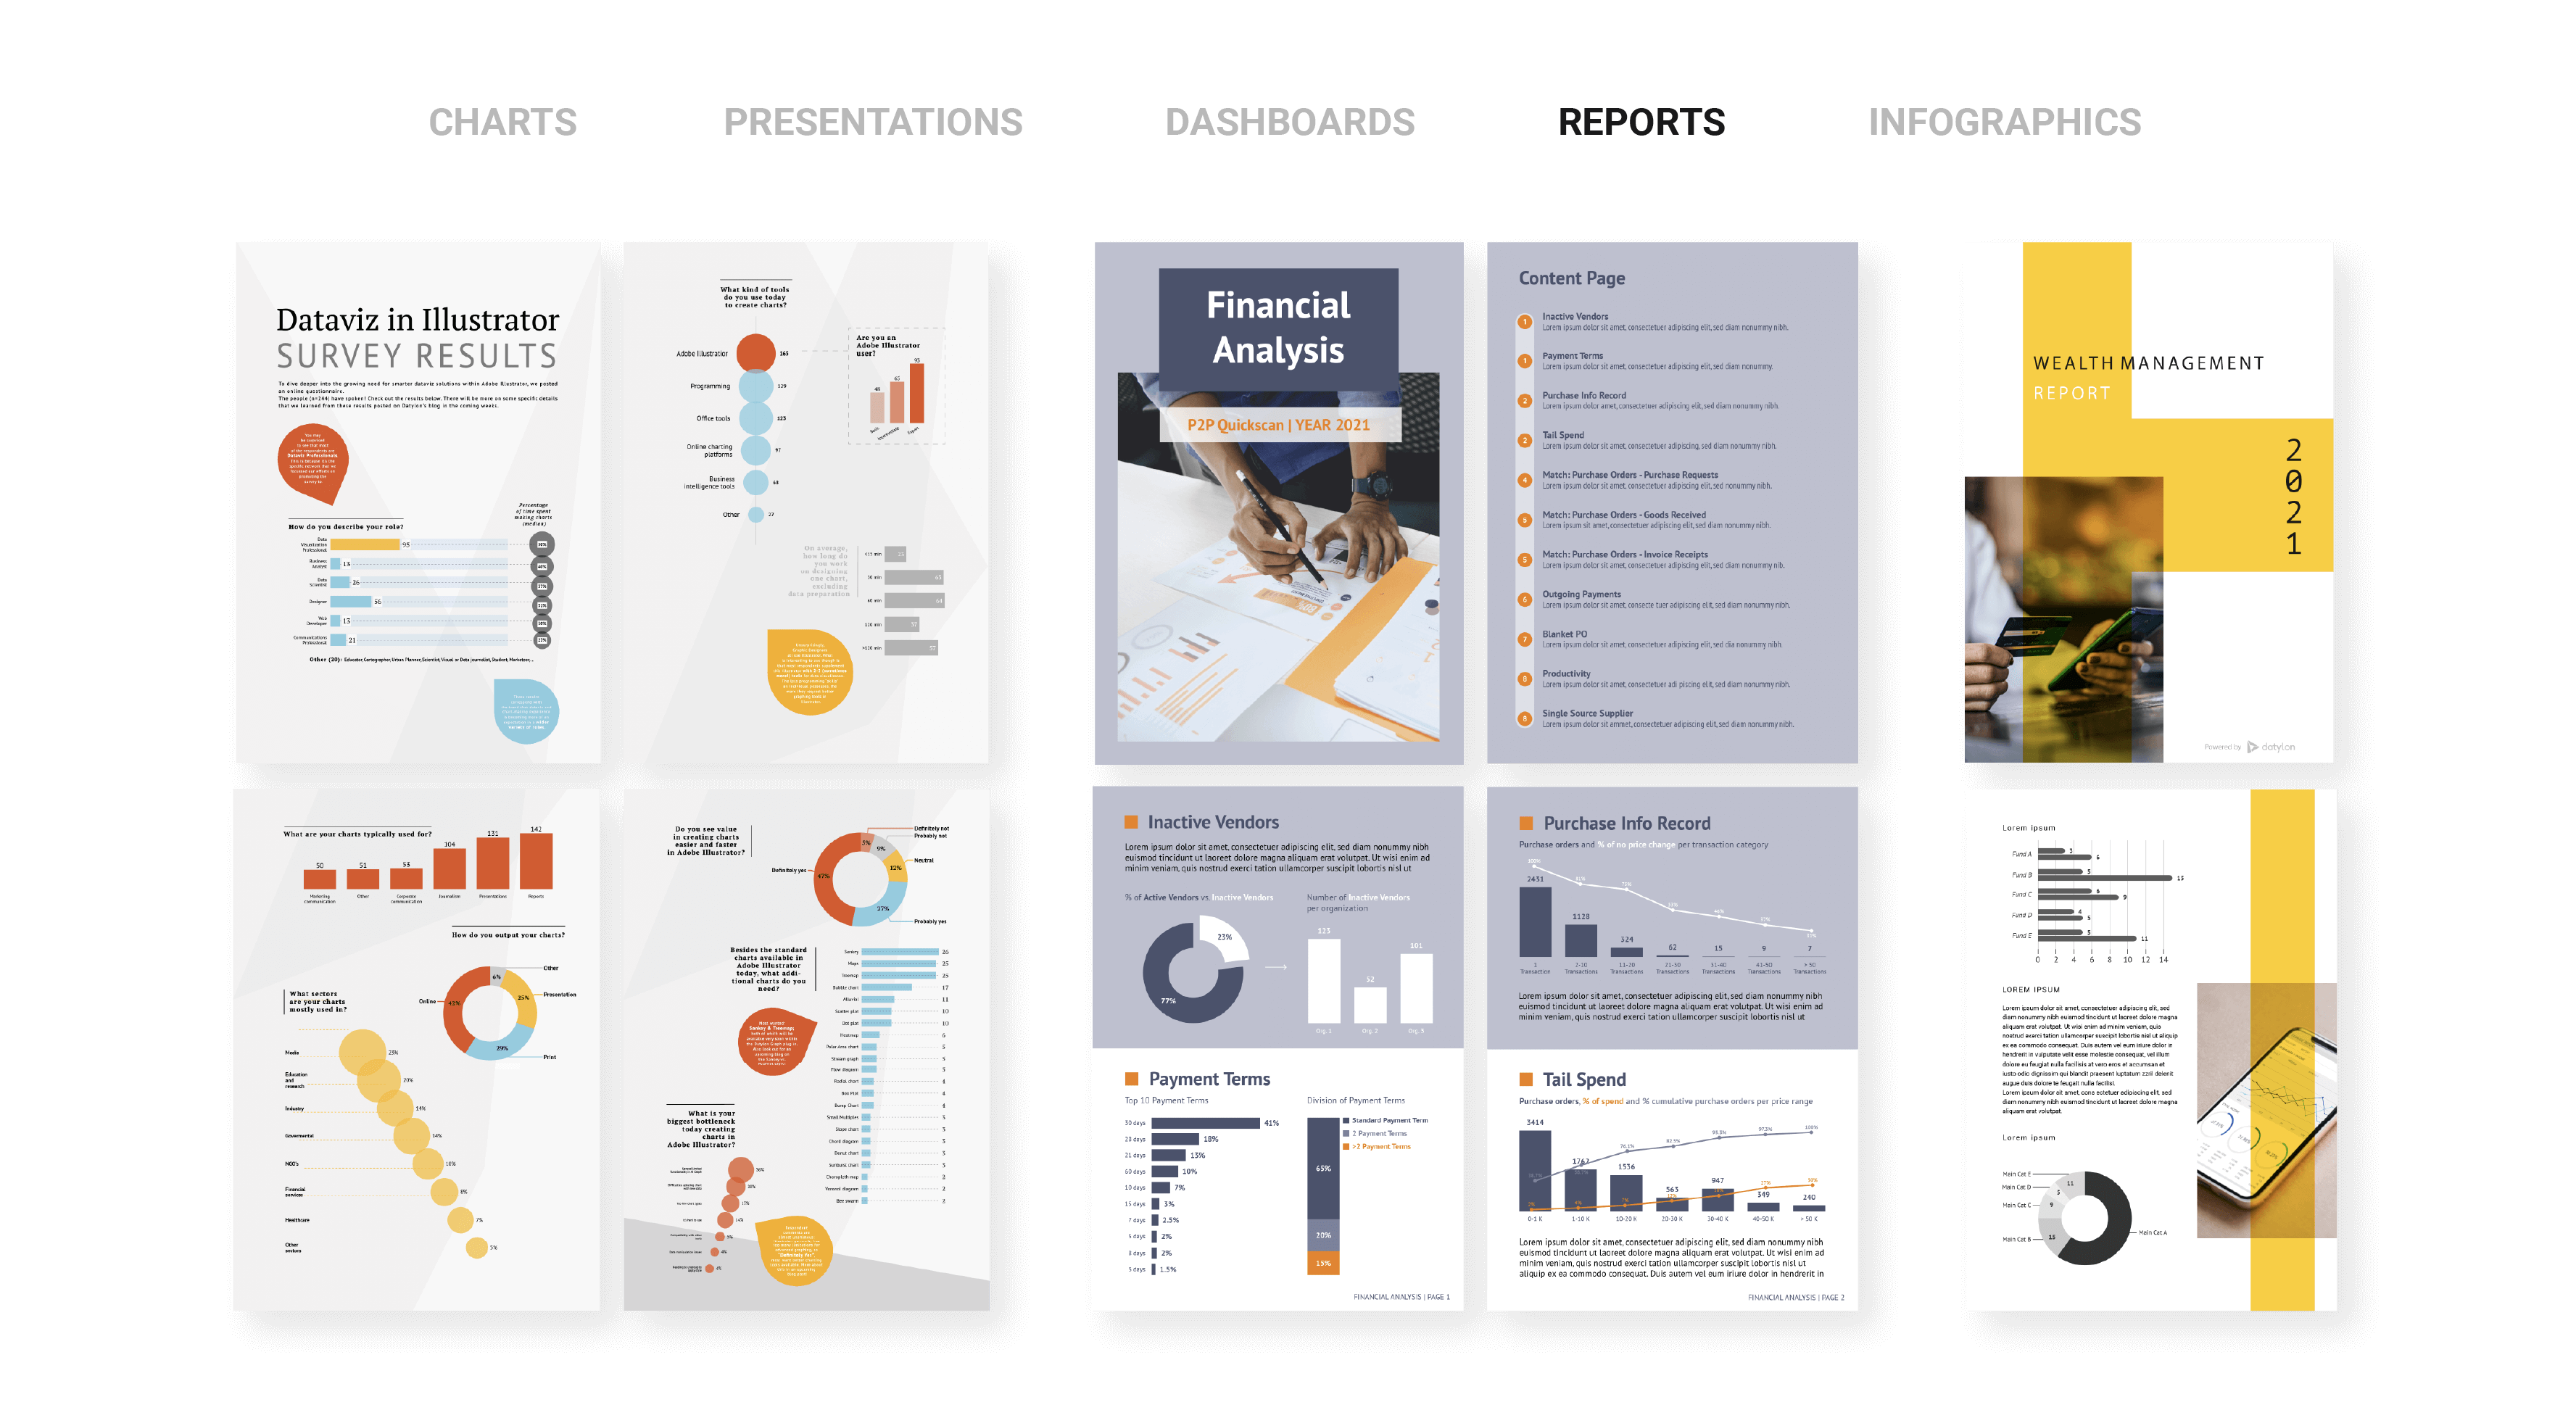
Simplify your reporting workflow
Easily download and collaborate with your designer on pre-designed custom templates for single charts or complete slides, ensuring consistency across slides and presentations.
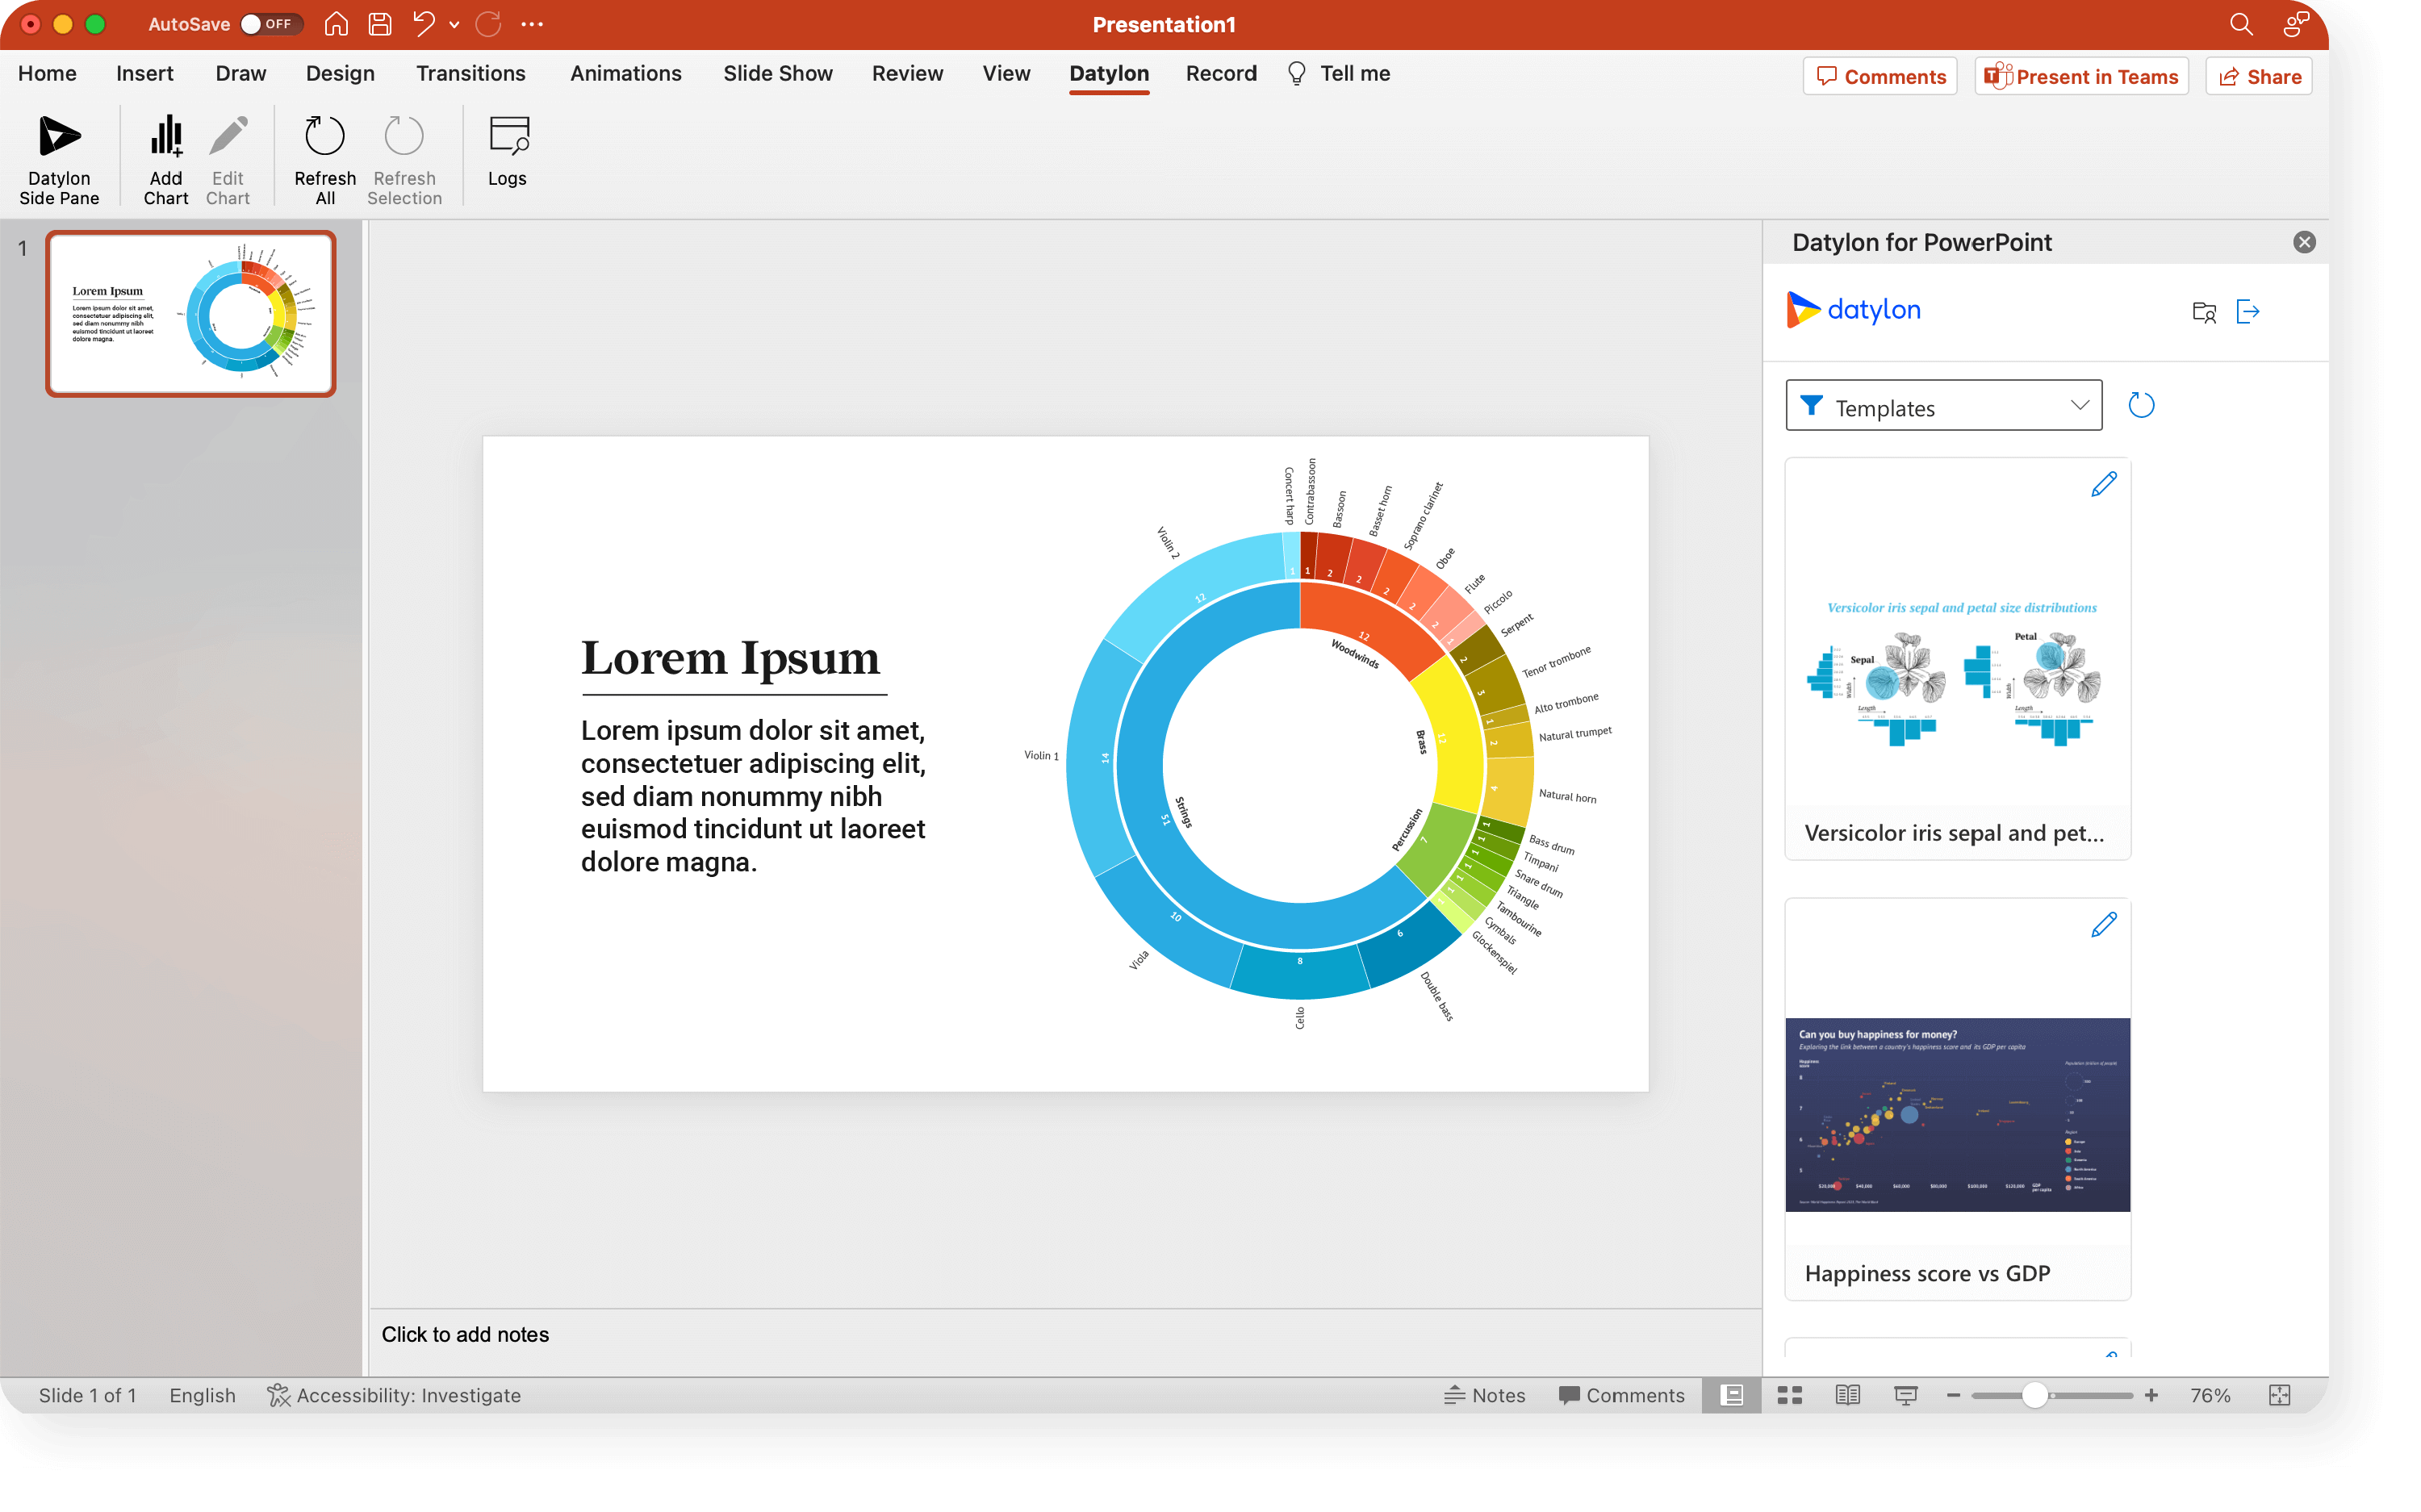
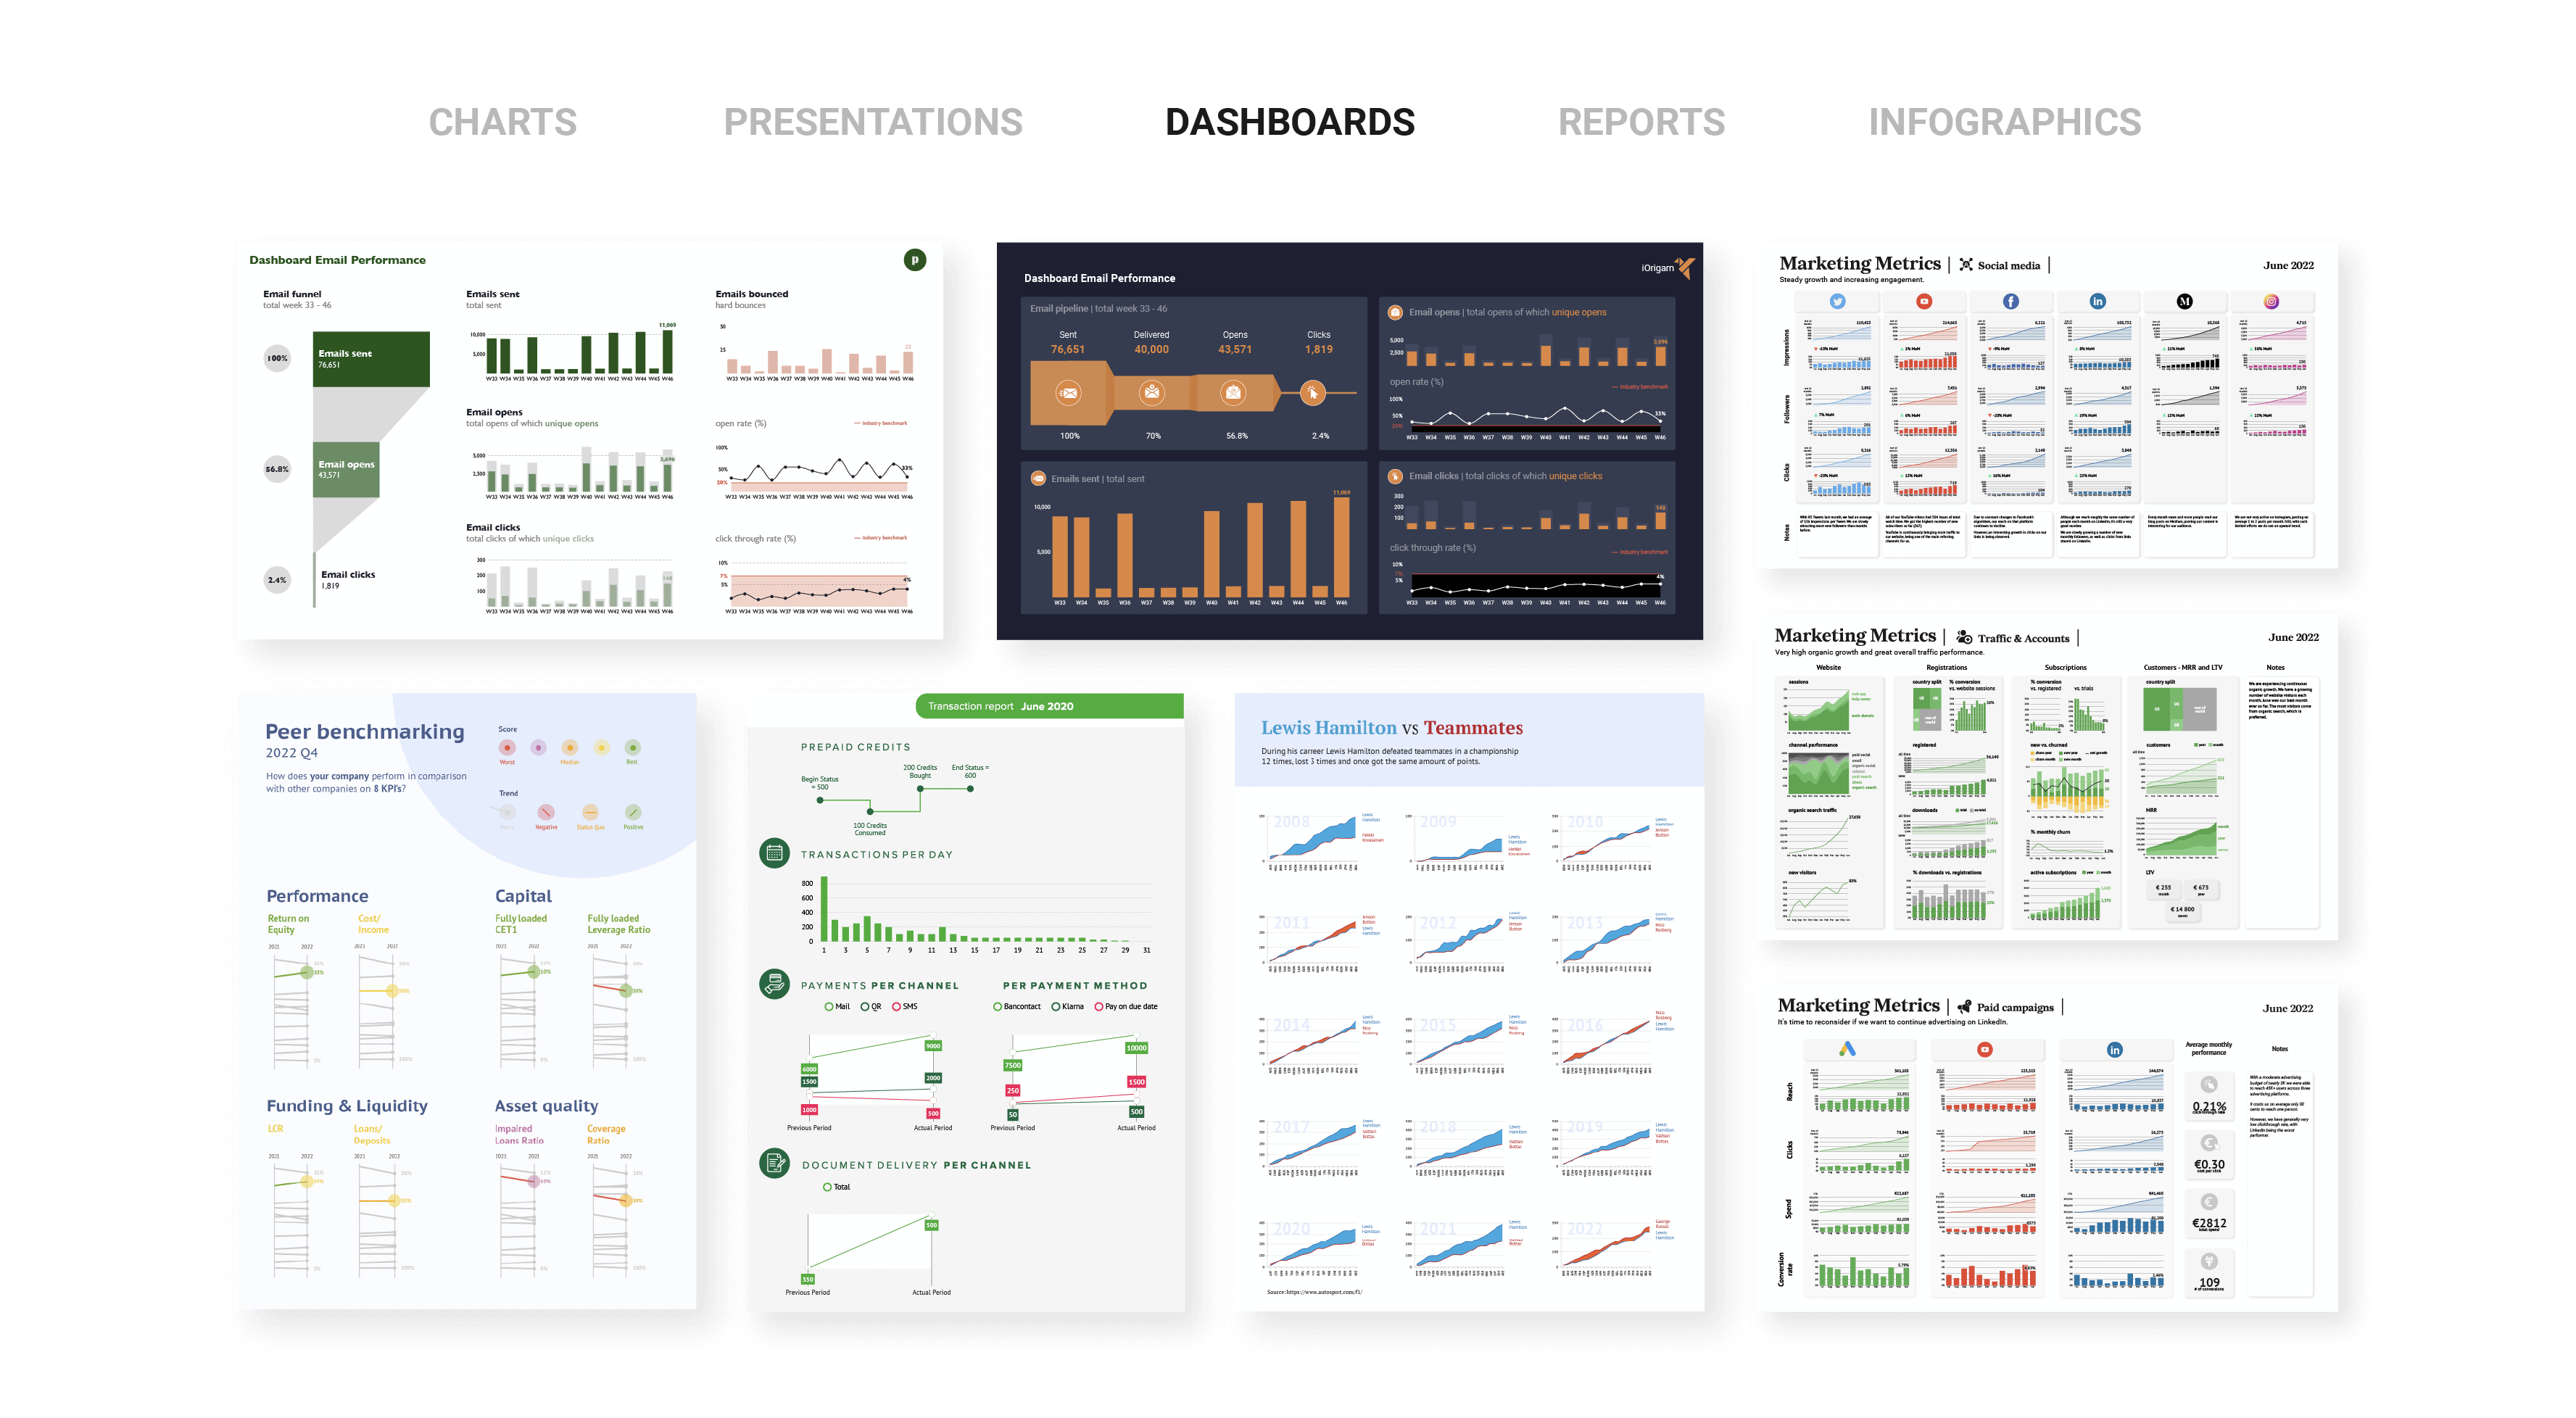
Stunning charts & reports in Microsoft PowerPoint
Unleash your creativity and style charts exactly as you envision. Customize numerous graphic properties to achieve pixel-perfect visualizations tailored to your brand and preferences.
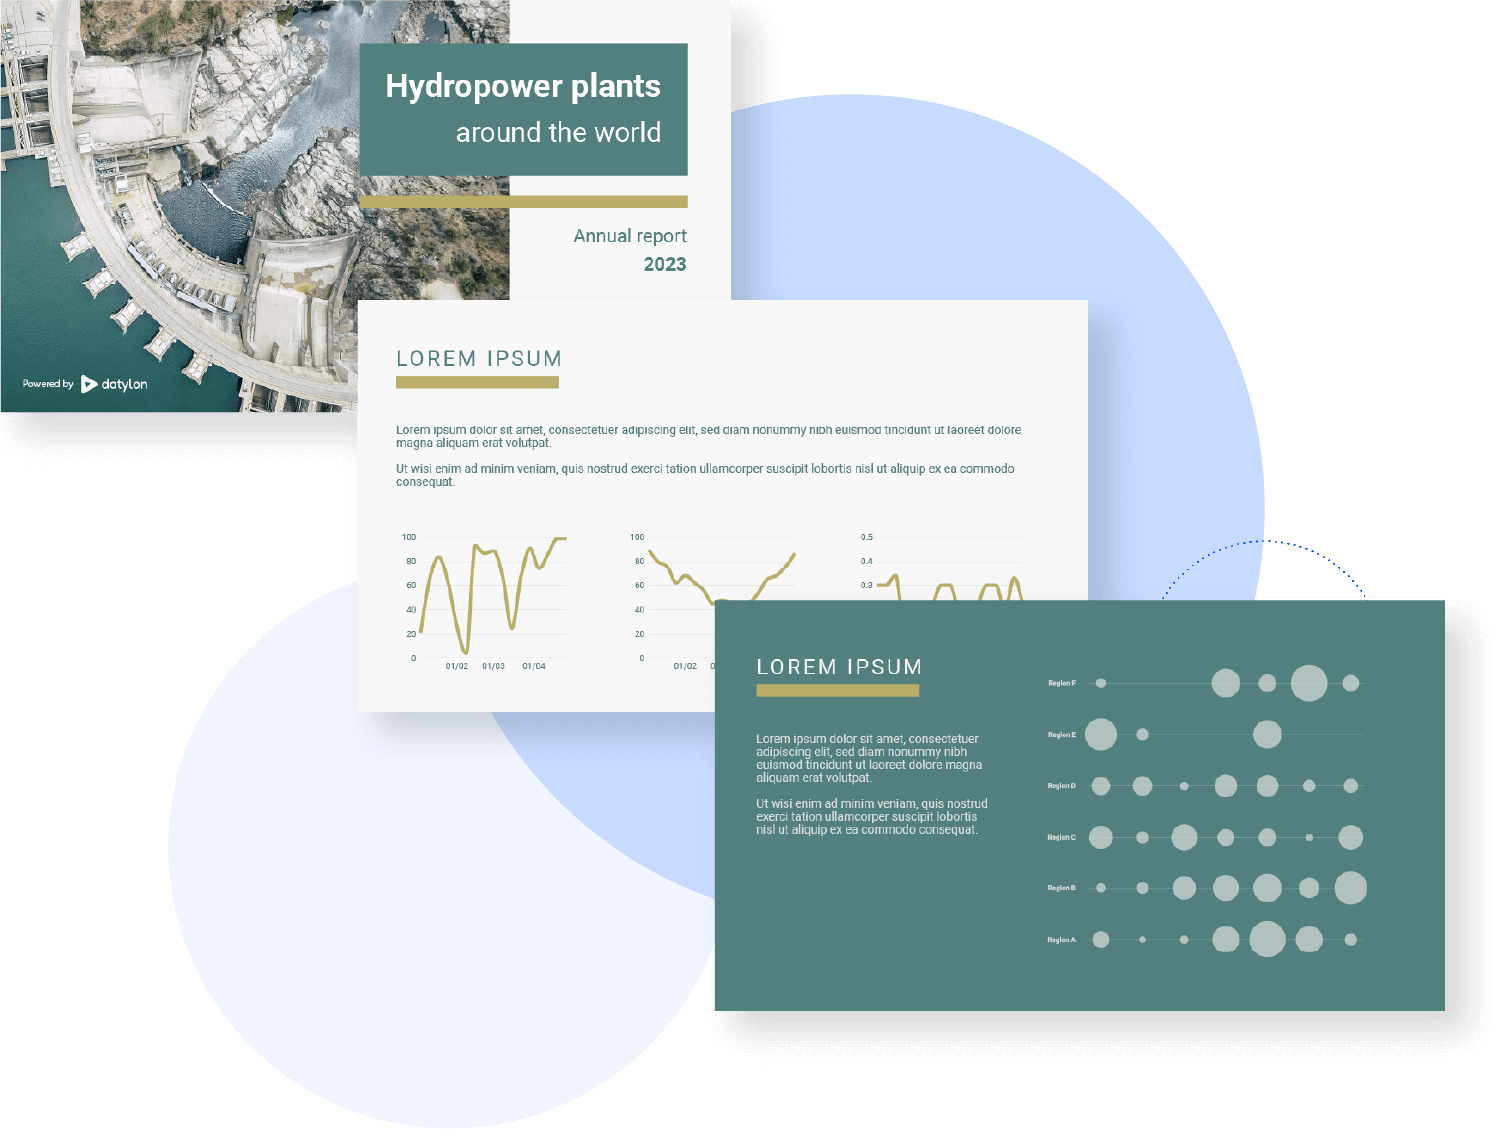
Your data, your style
Present your data with branded charts and reports that resonate with your audience, enhancing your brand's narrative and credibility. Reinforce your message with compelling data-driven stories.
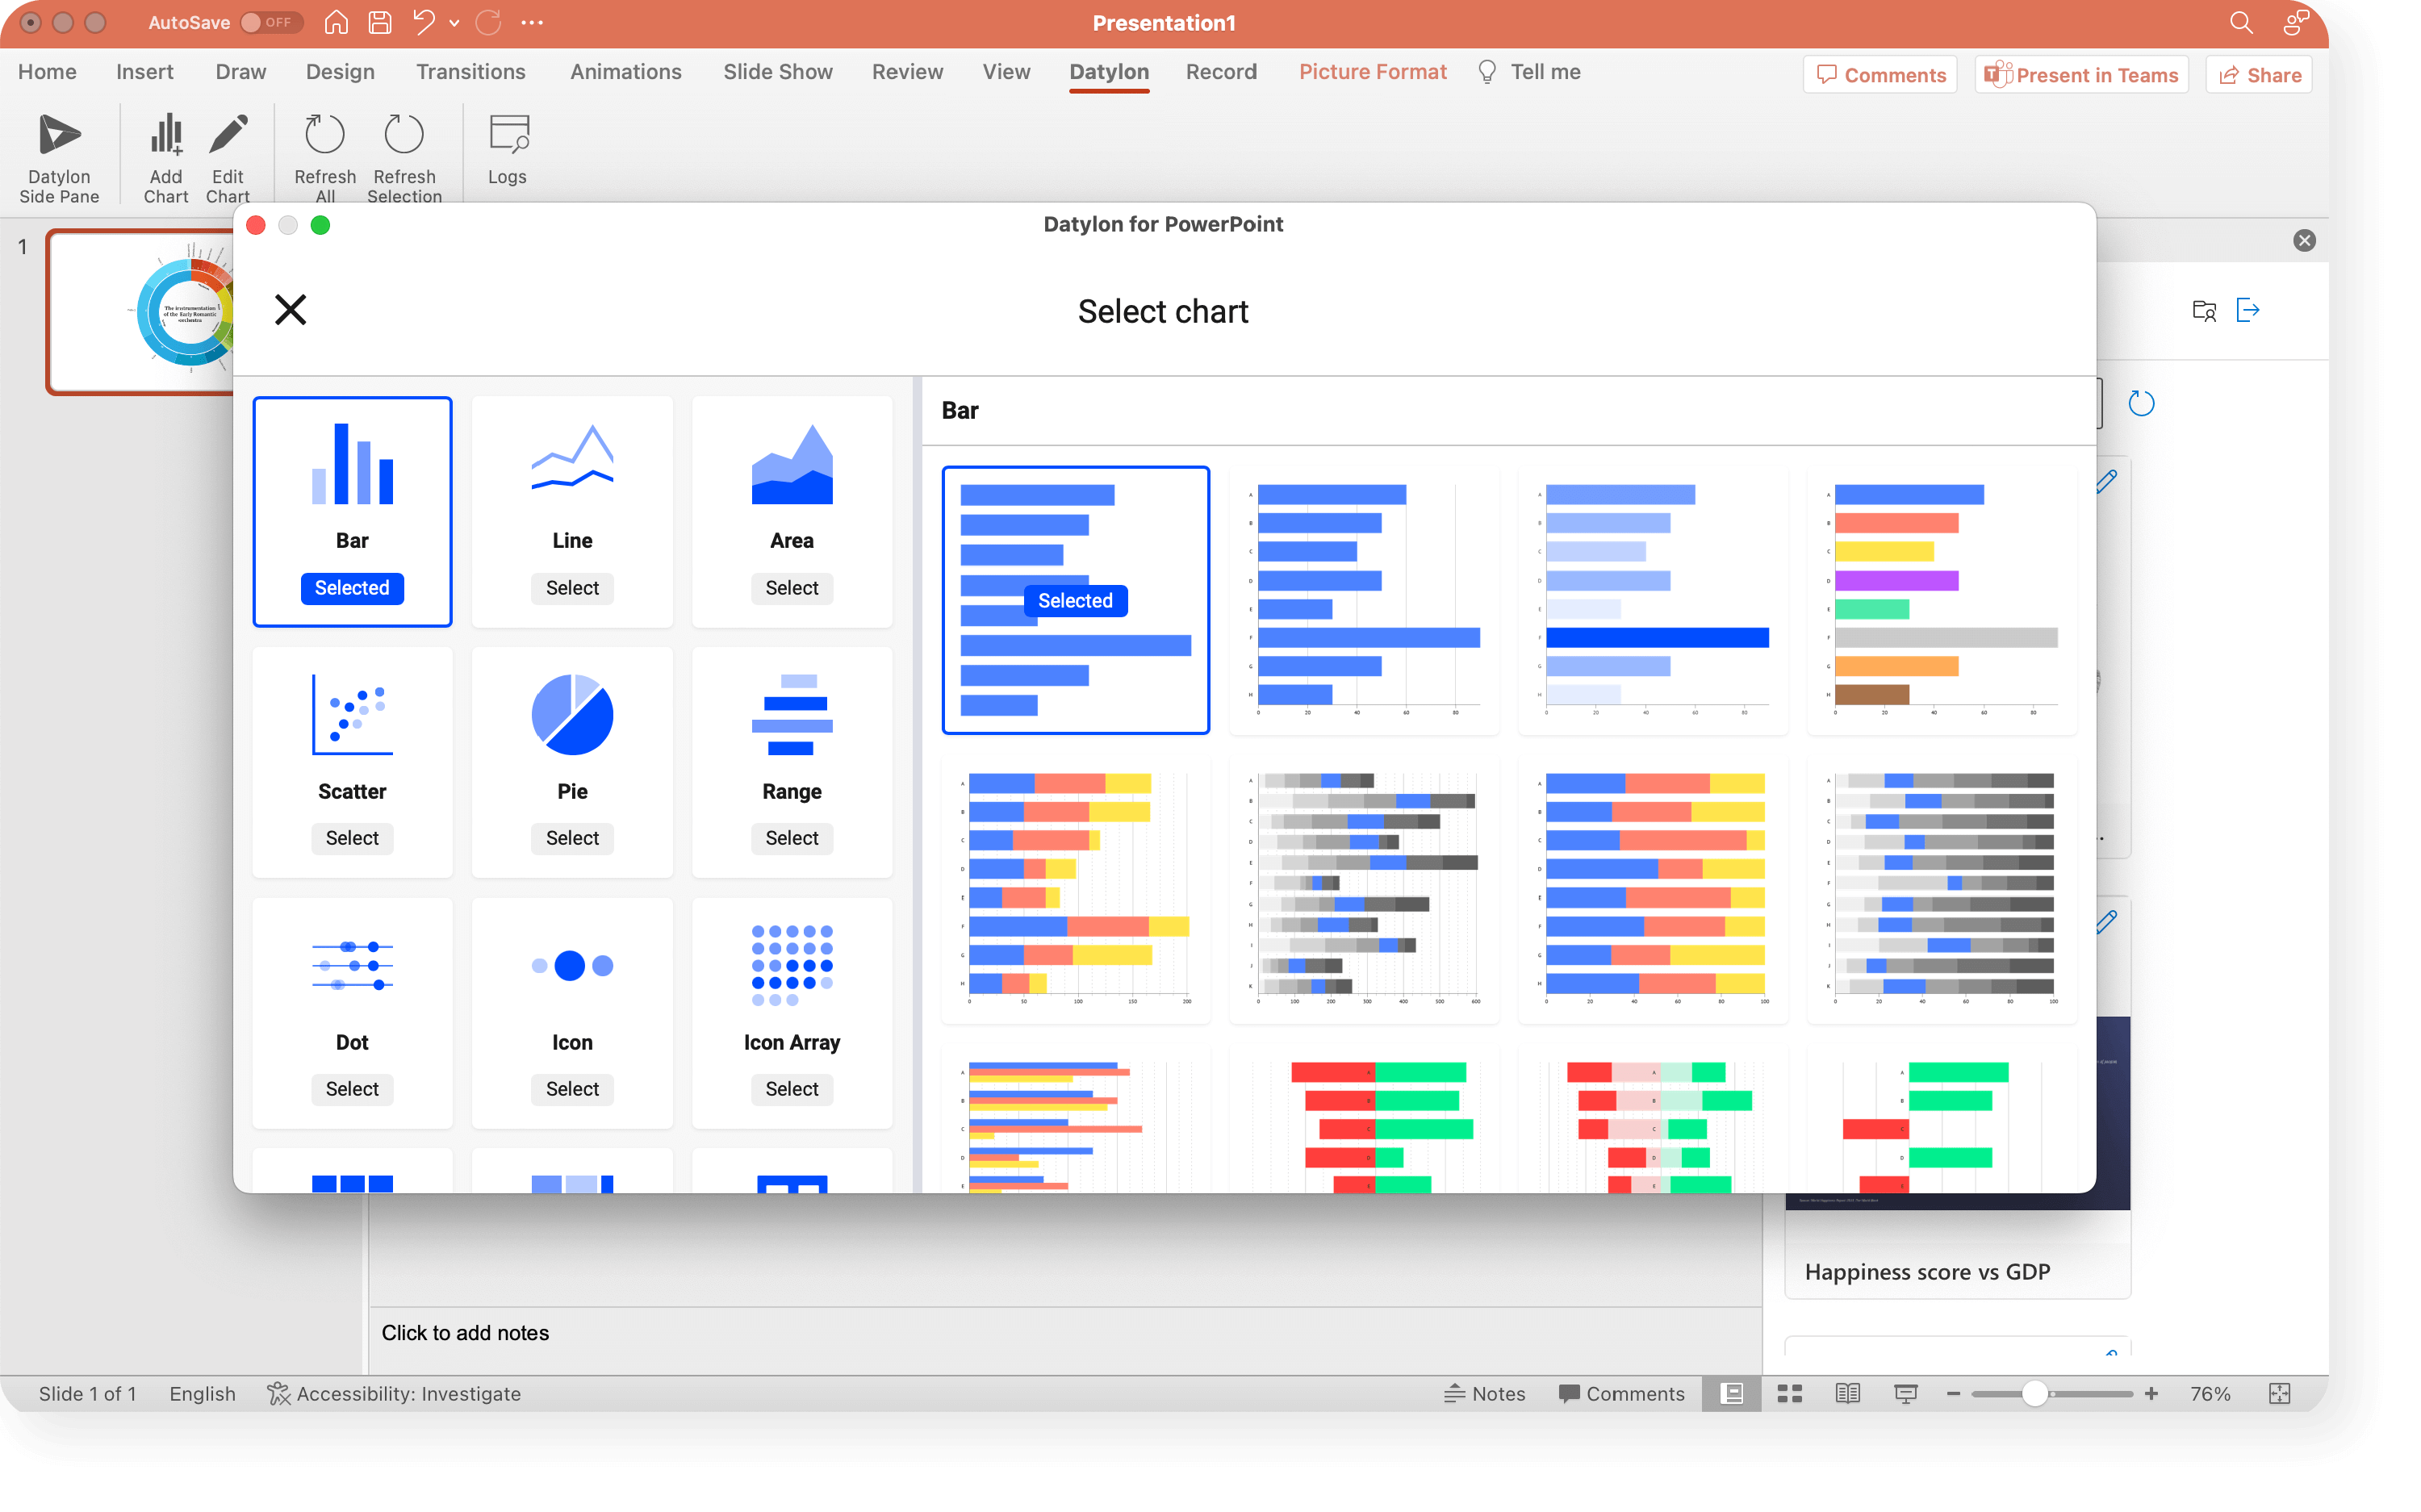
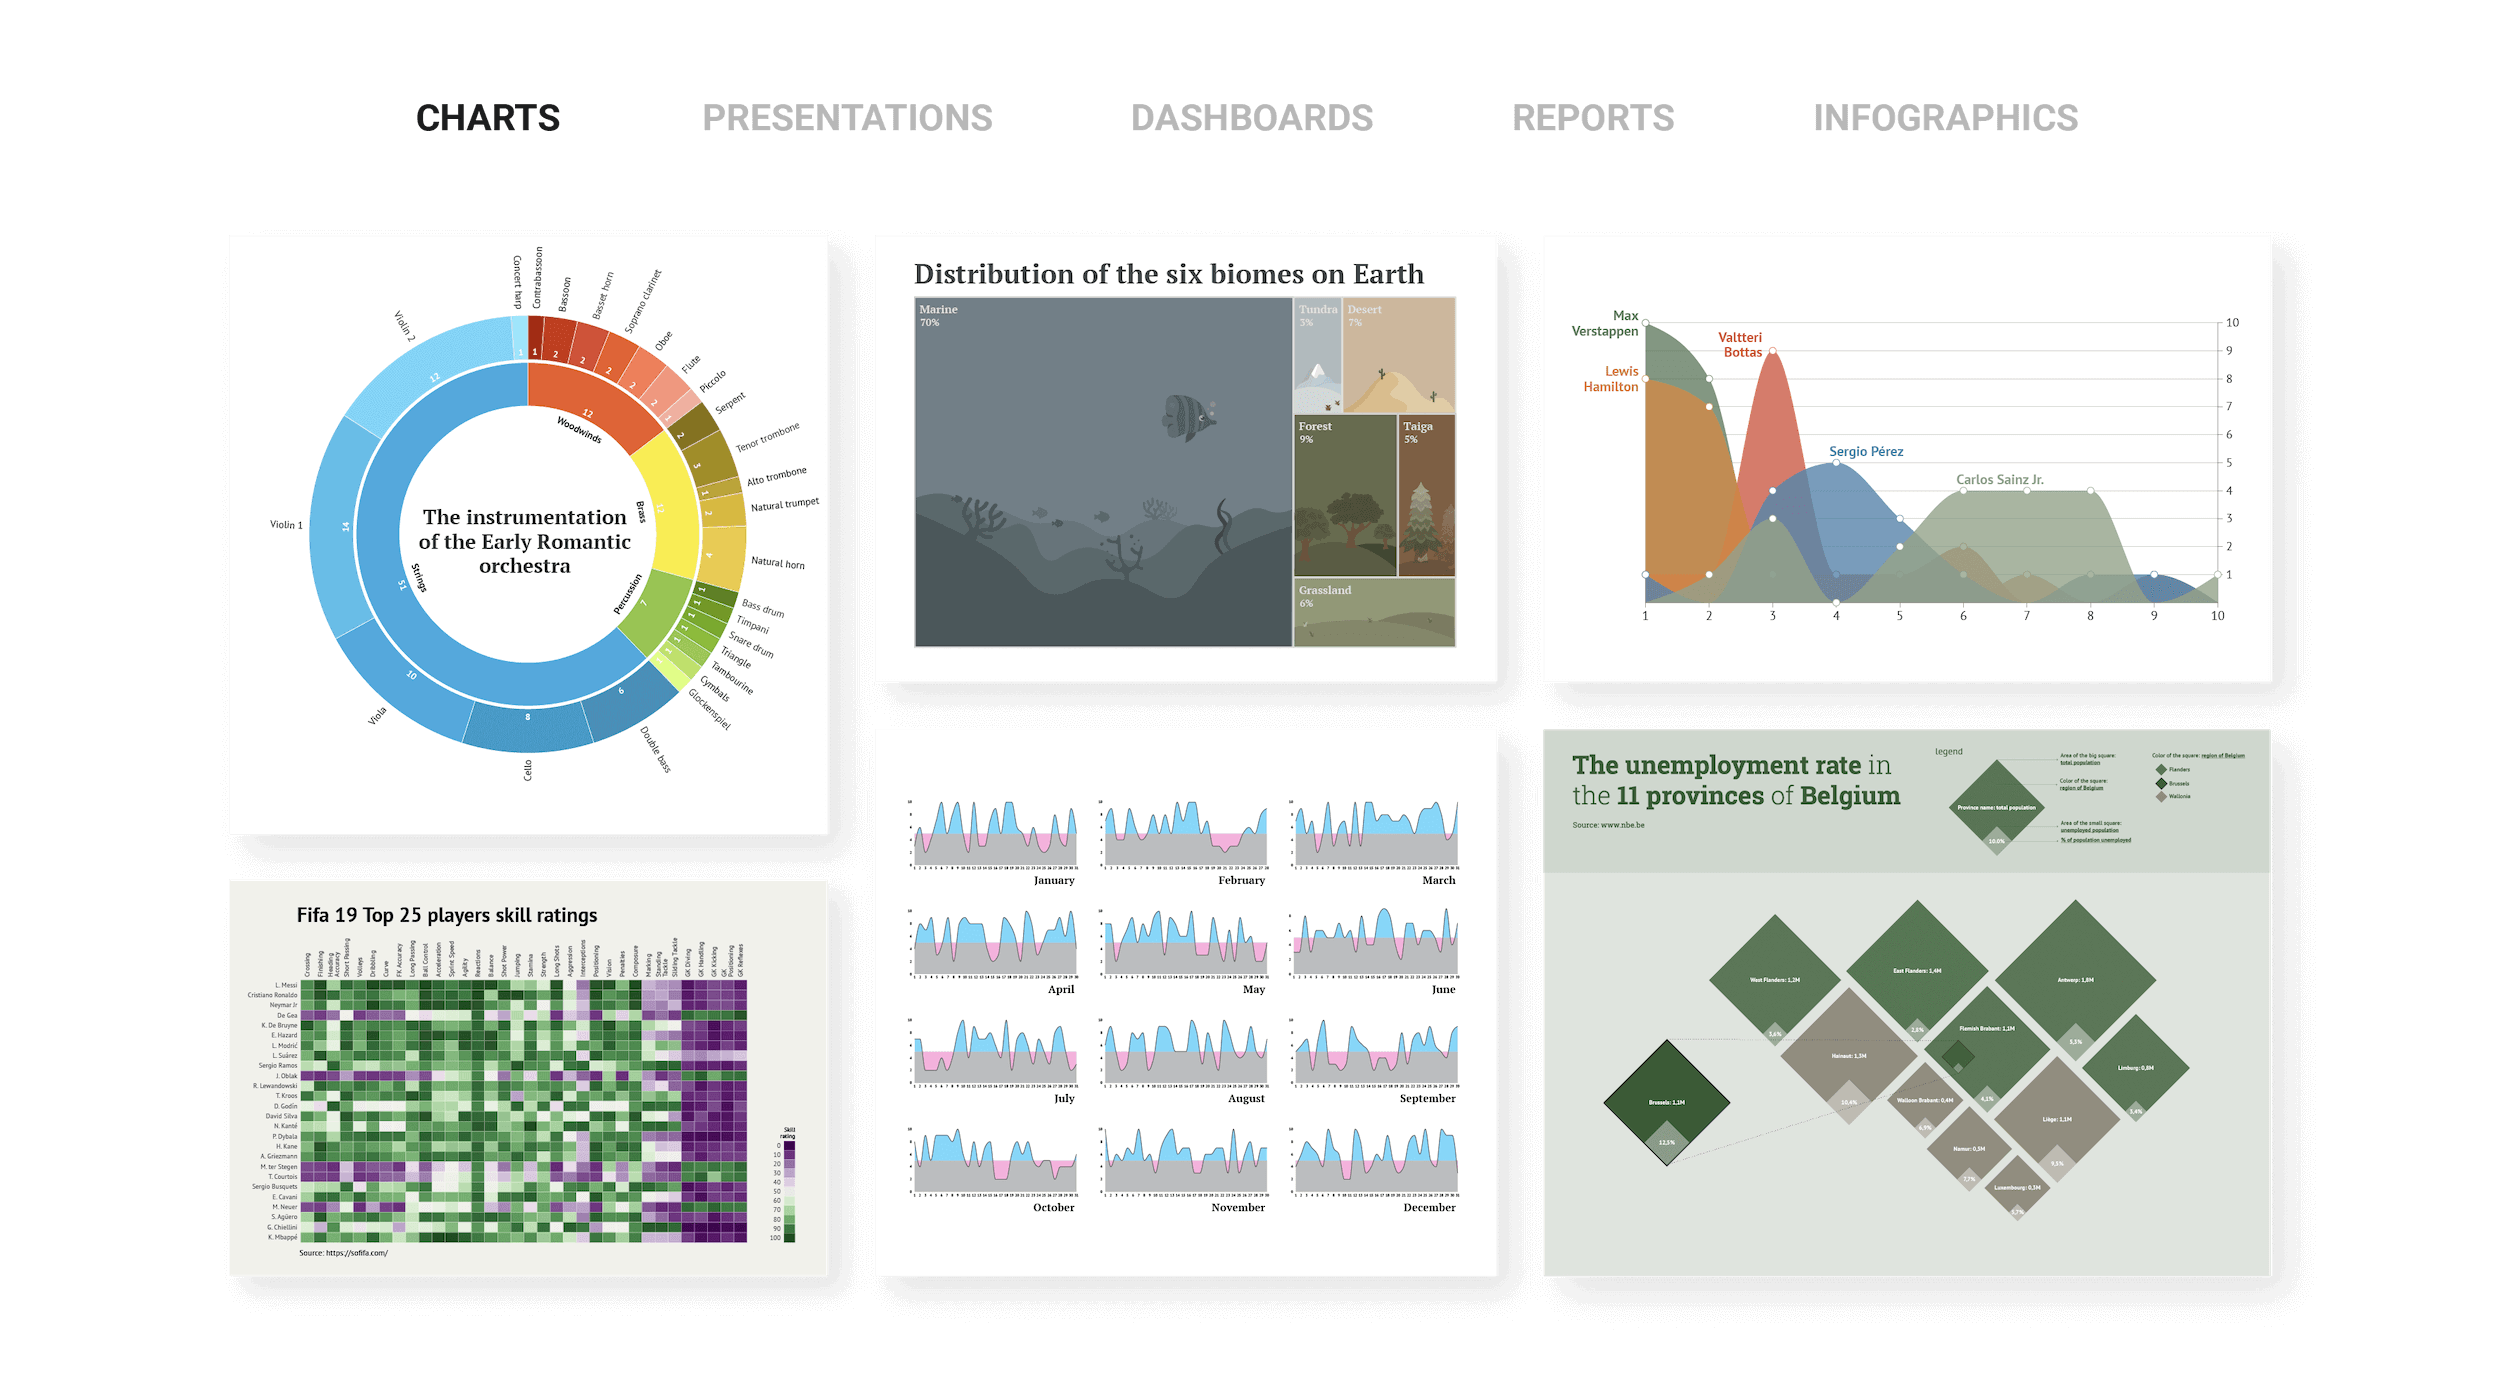
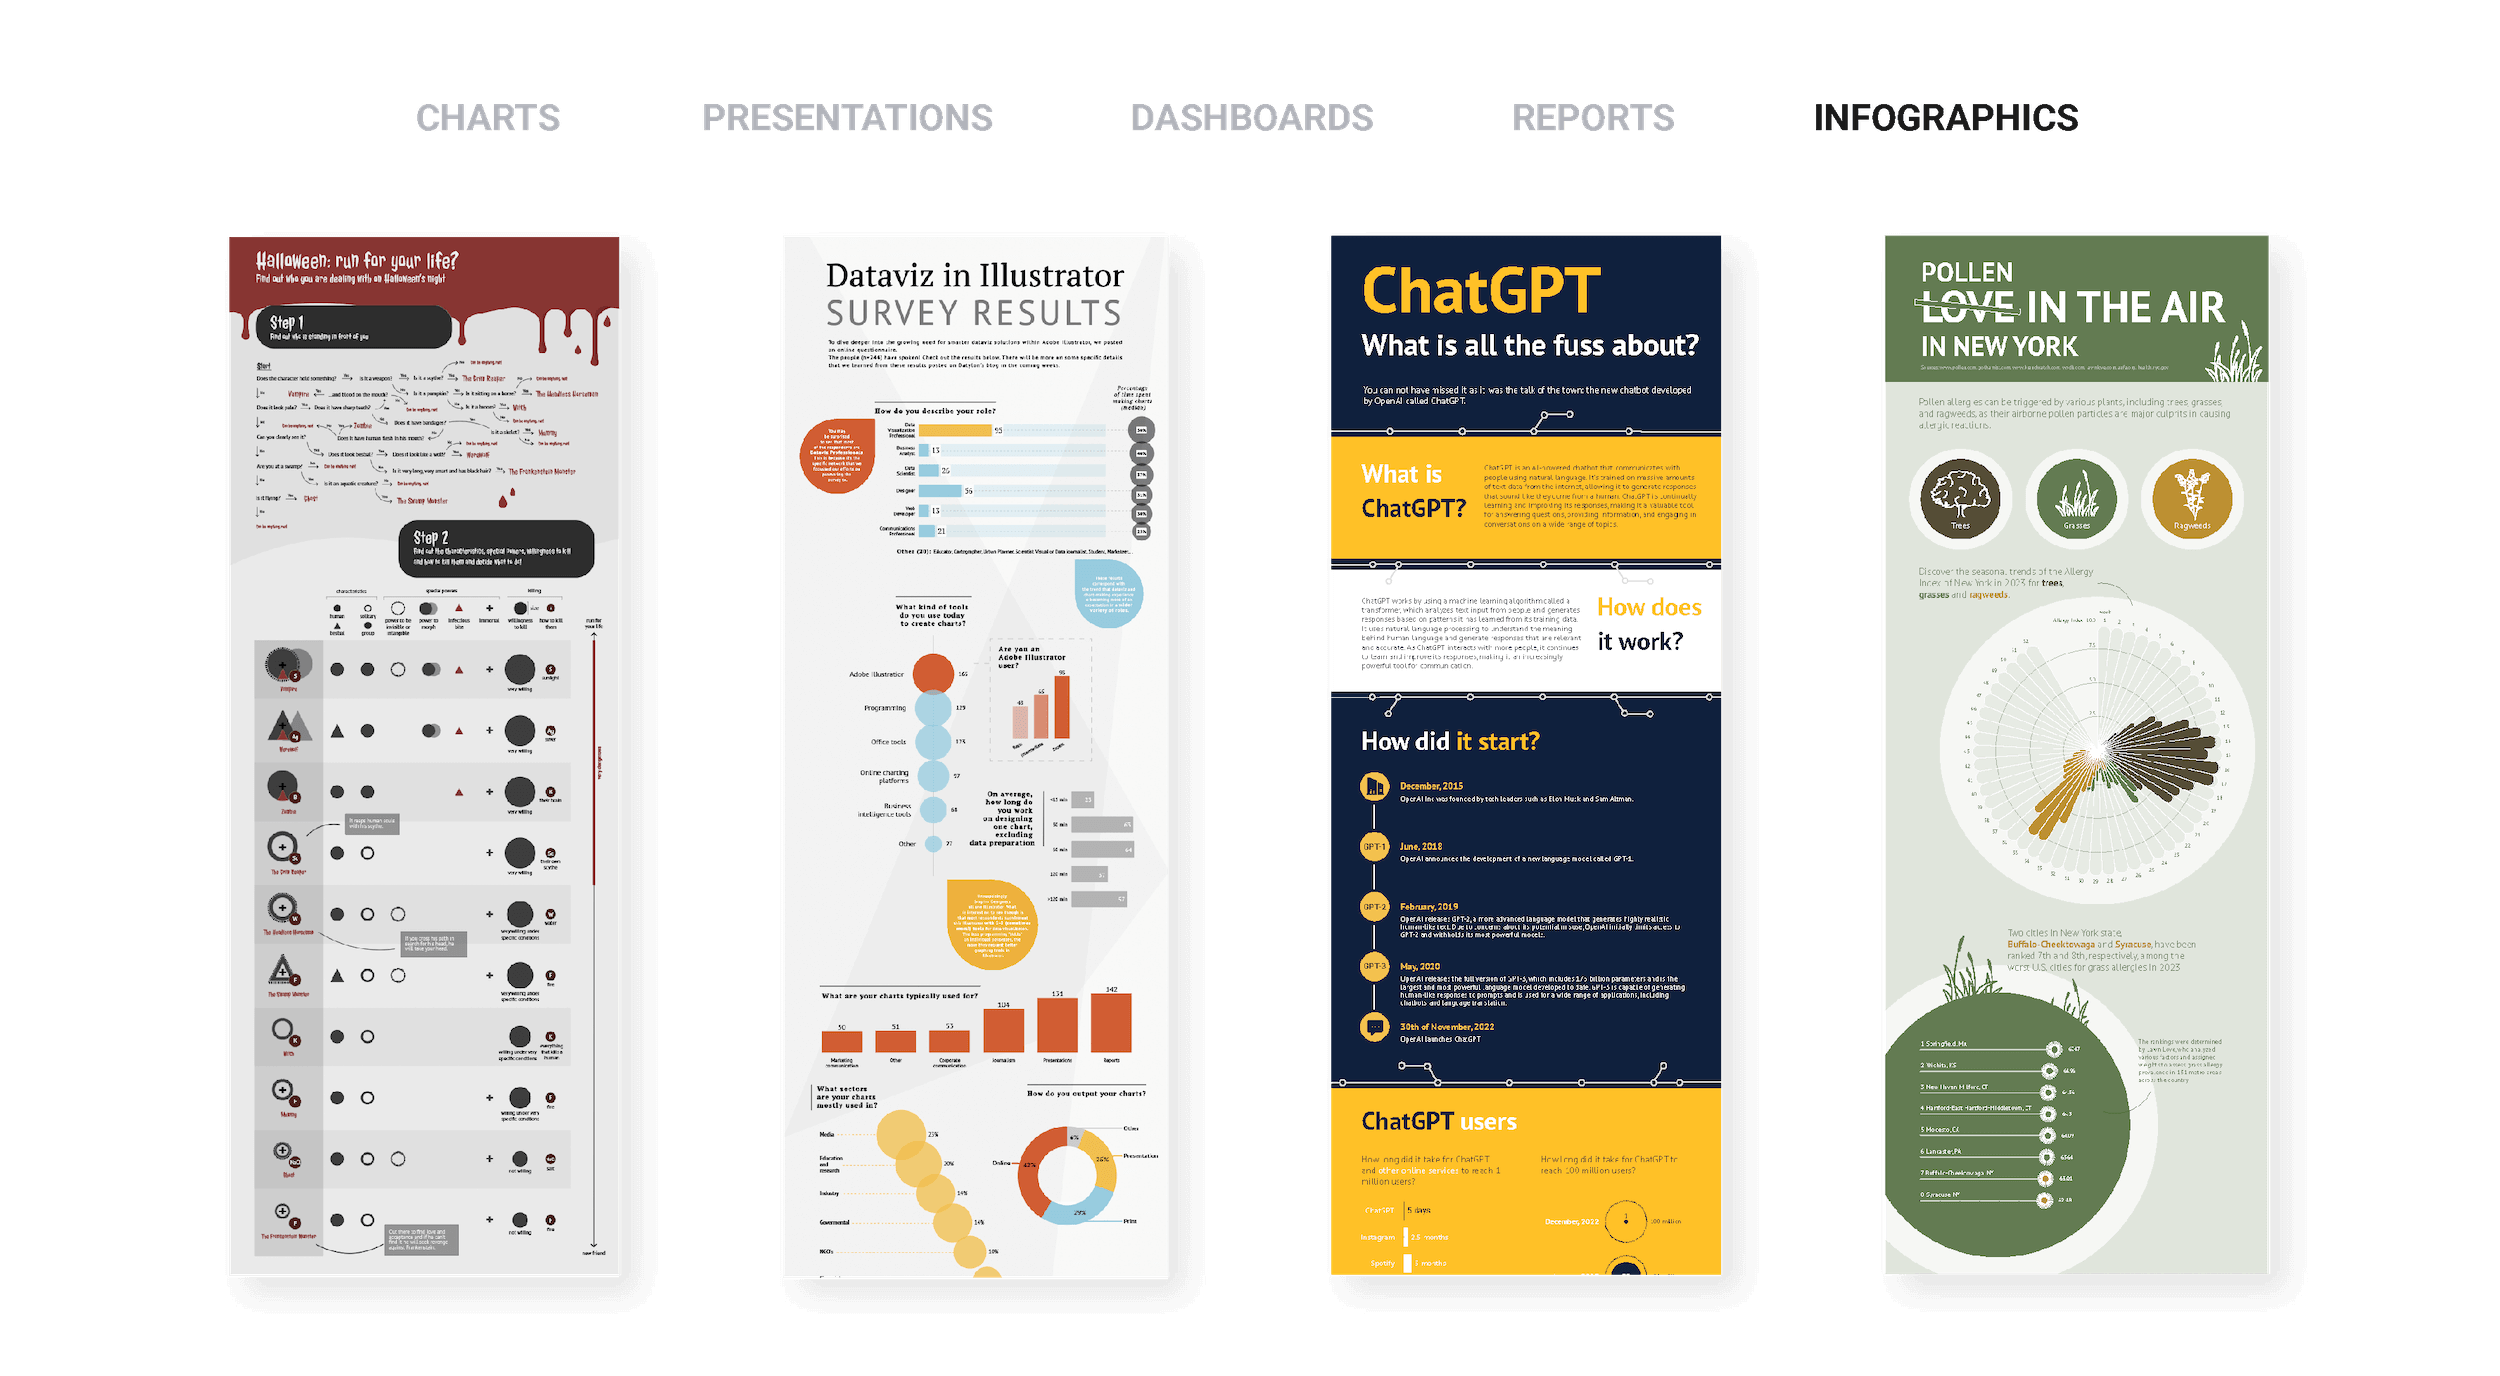
Data visualization made easier
Elevate your presentations with a vast array of 130+ chart types to choose from. Whether it's a simple slide or a comprehensive report, you'll find the perfect visualization to convey your data effectively.
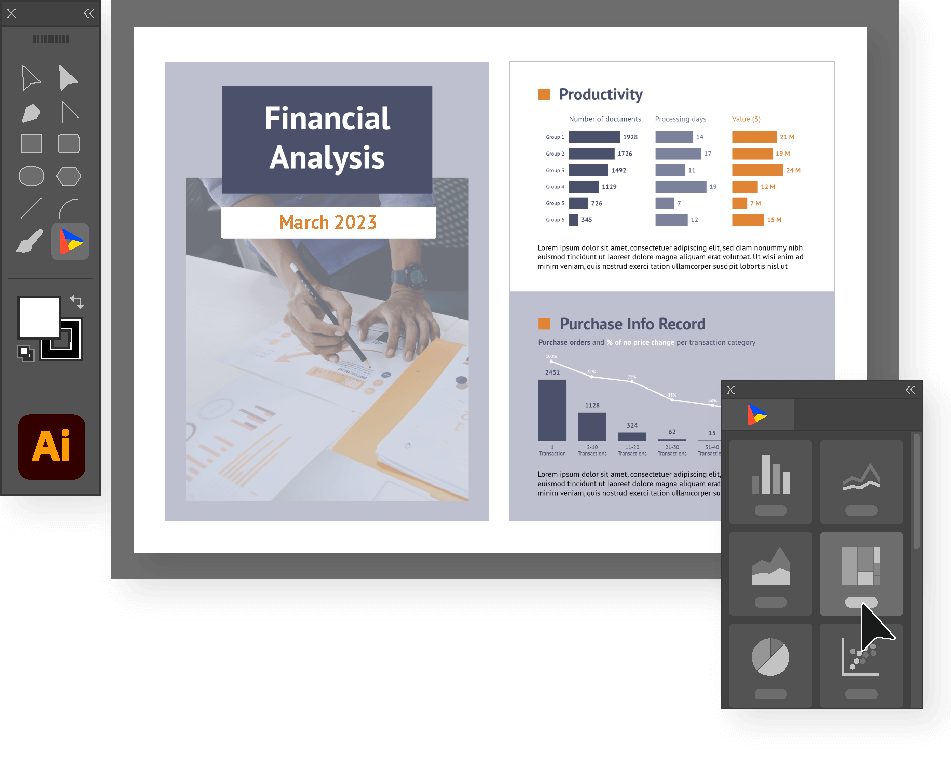
Datylon for Illustrator
Design beautiful charts and report templates right within Adobe Illustrator.
Discover the plug-in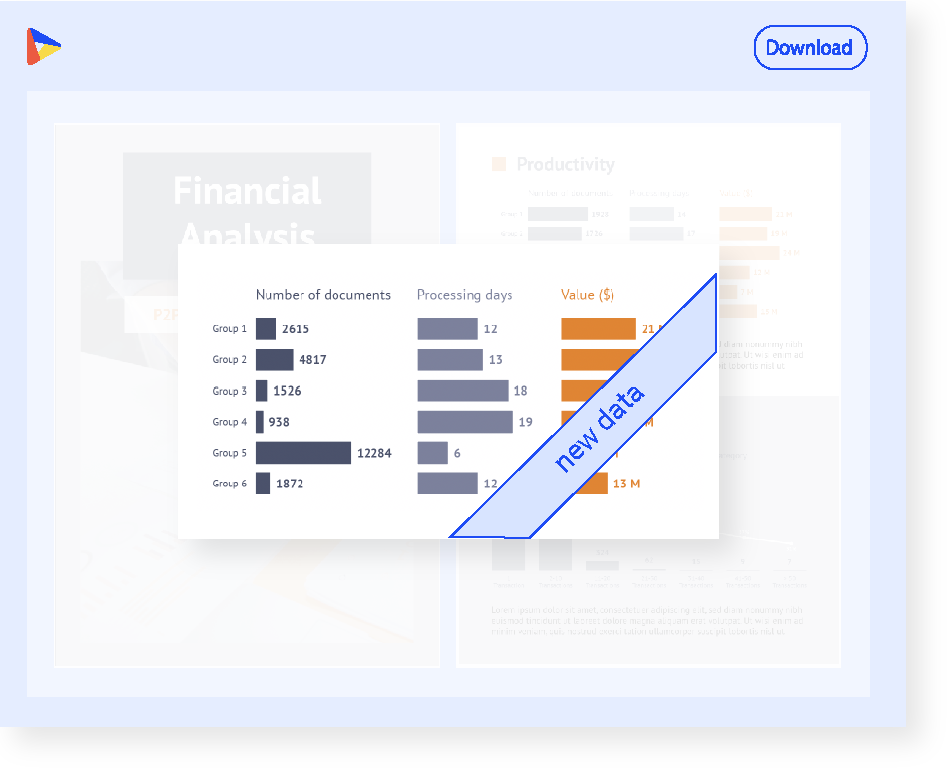
Datylon Report Studio
Produce on-brand, periodic reports based on your pre-designed templates.
Read more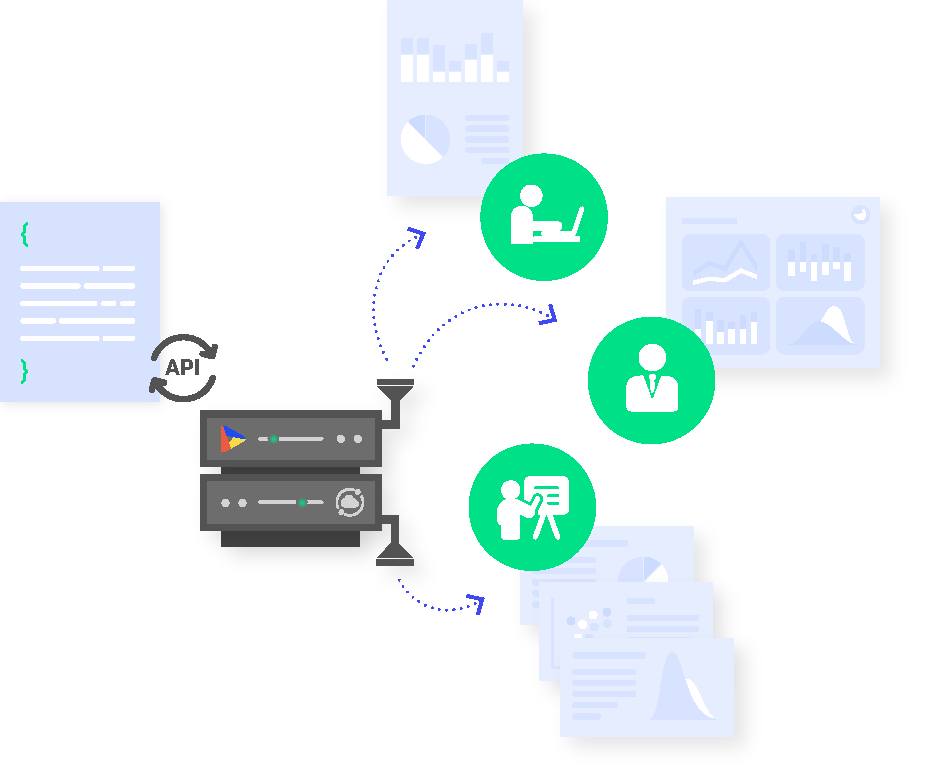
Datylon Report Server
Automate the production of your periodic personalized reports or slides.
Learn how it works