CHARTS & GRAPHS > HISTOGRAM

Histogram maker

Create and share your own histogram with our histogram maker, and customize it to your liking.

Creating your custom histogram with online and offline tools from Datylon.

datylon-histogram-maker-page-1

Free online histogram maker, no credit card needed.

Make a fully customizable and reusable histogram.

Keep your histogram design private or public.

Unlimited designs and online views.

Organizations that trust us globally

Get inspired

Scroll and click on the images below to find inspiration samples of histograms and other similar charts. With your Datylon account, you can use these designs, customize them and update them with your new data.
datylon-histogram-maker-page-2
STYLING PROPERTIES

Fully customizable histogram

All elements in your histogramt such as labels, data marks, and axes can be styled to the smallest detail matching the most demanding design requirements. Background, bars, stroke width, position, alignment: all tools are at hand to unleash your creativity and get the message of the histogram across.

datylon-histogram-maker-page-3
DATA SHEET MANAGER

Organize your data

Load and store your xls, xlsx or csv data into the histogram maker and link it with one or more charts in your designs. Manage your data sheets in workbooks and keep everything nicely organized and secured.

datylon-histogram-maker-page-4
OUTPUT

Easily share your chart

Bring the right message across using your histograms. Import them as SVG or PNG in PowerPoint, Google Slides, or other tools and have your presentation look professional and on-brand. You can also easily embed them into your website or application.

The power of proof:
Customer case studies

See how our happy customers are using Datylon to achieve amazing results.

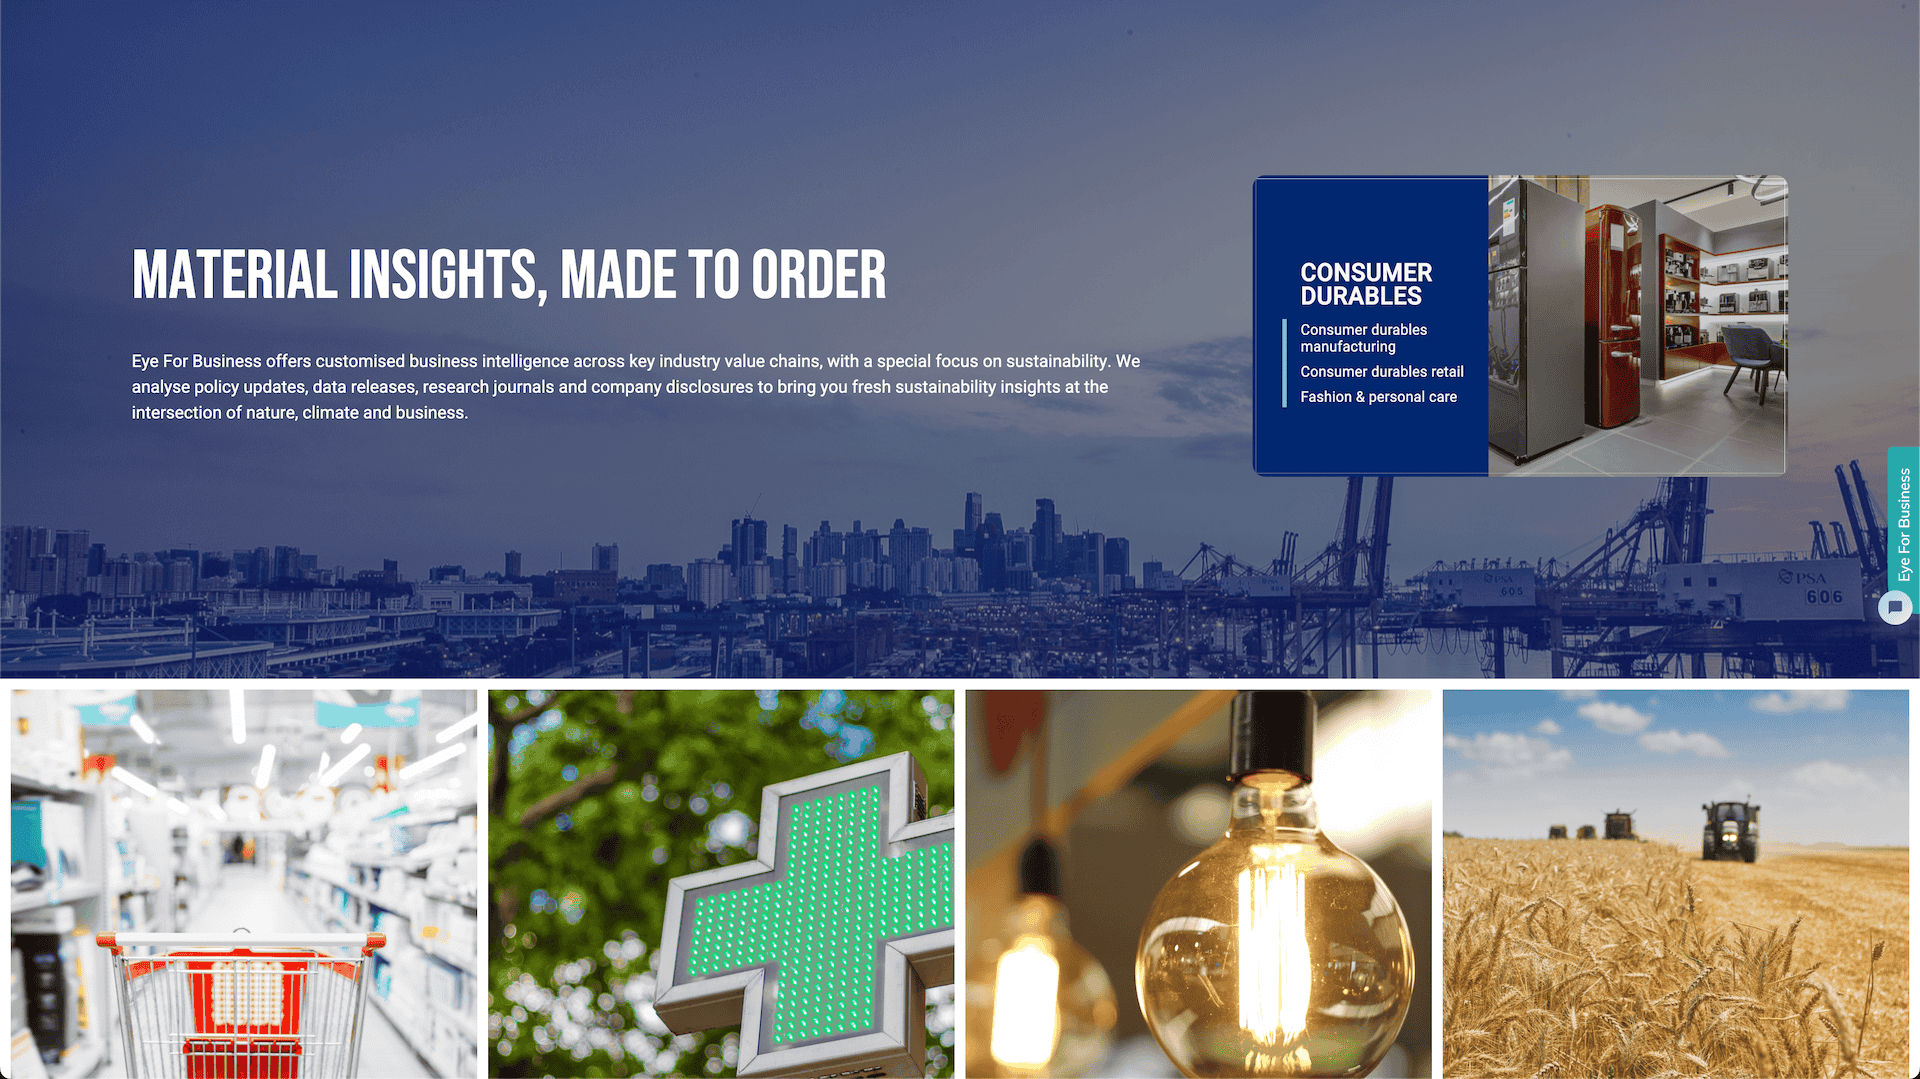
How Eye for Business Enhanced Sustainability Reporting with Datylon

Eye for Business is a platform that provides data-driven insights and expert guidance to empower...

Read More

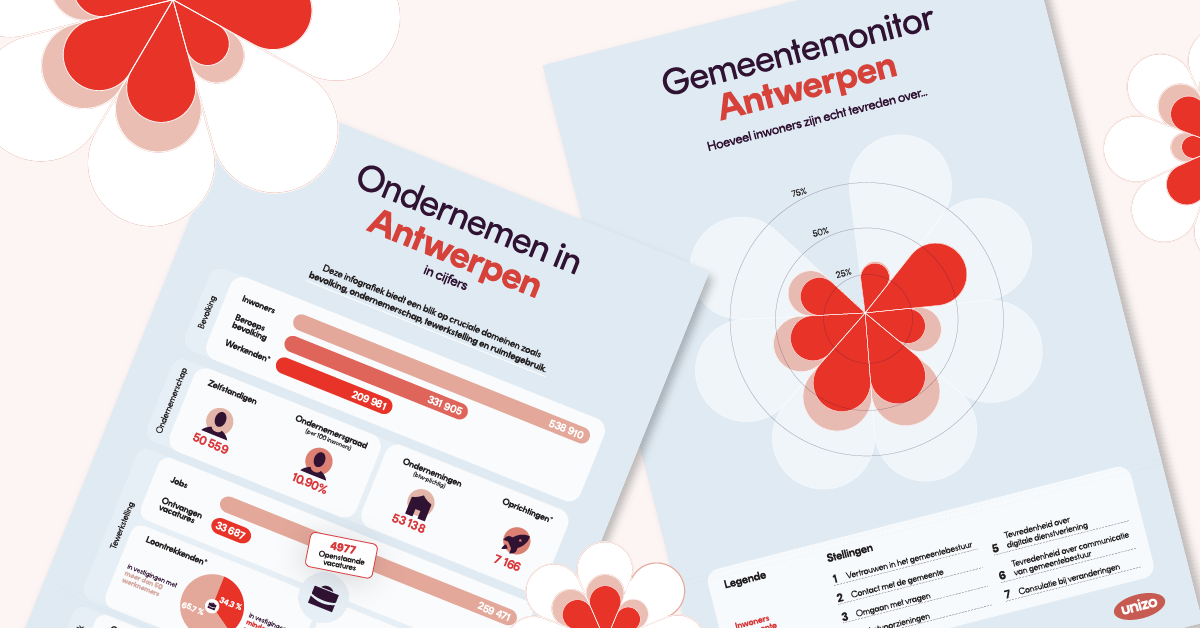
Targeted Reports to Empower Municipalities

Unizo is the largest Flemish employers’ organization in Belgium, representing over 80,000 small and...

Read More

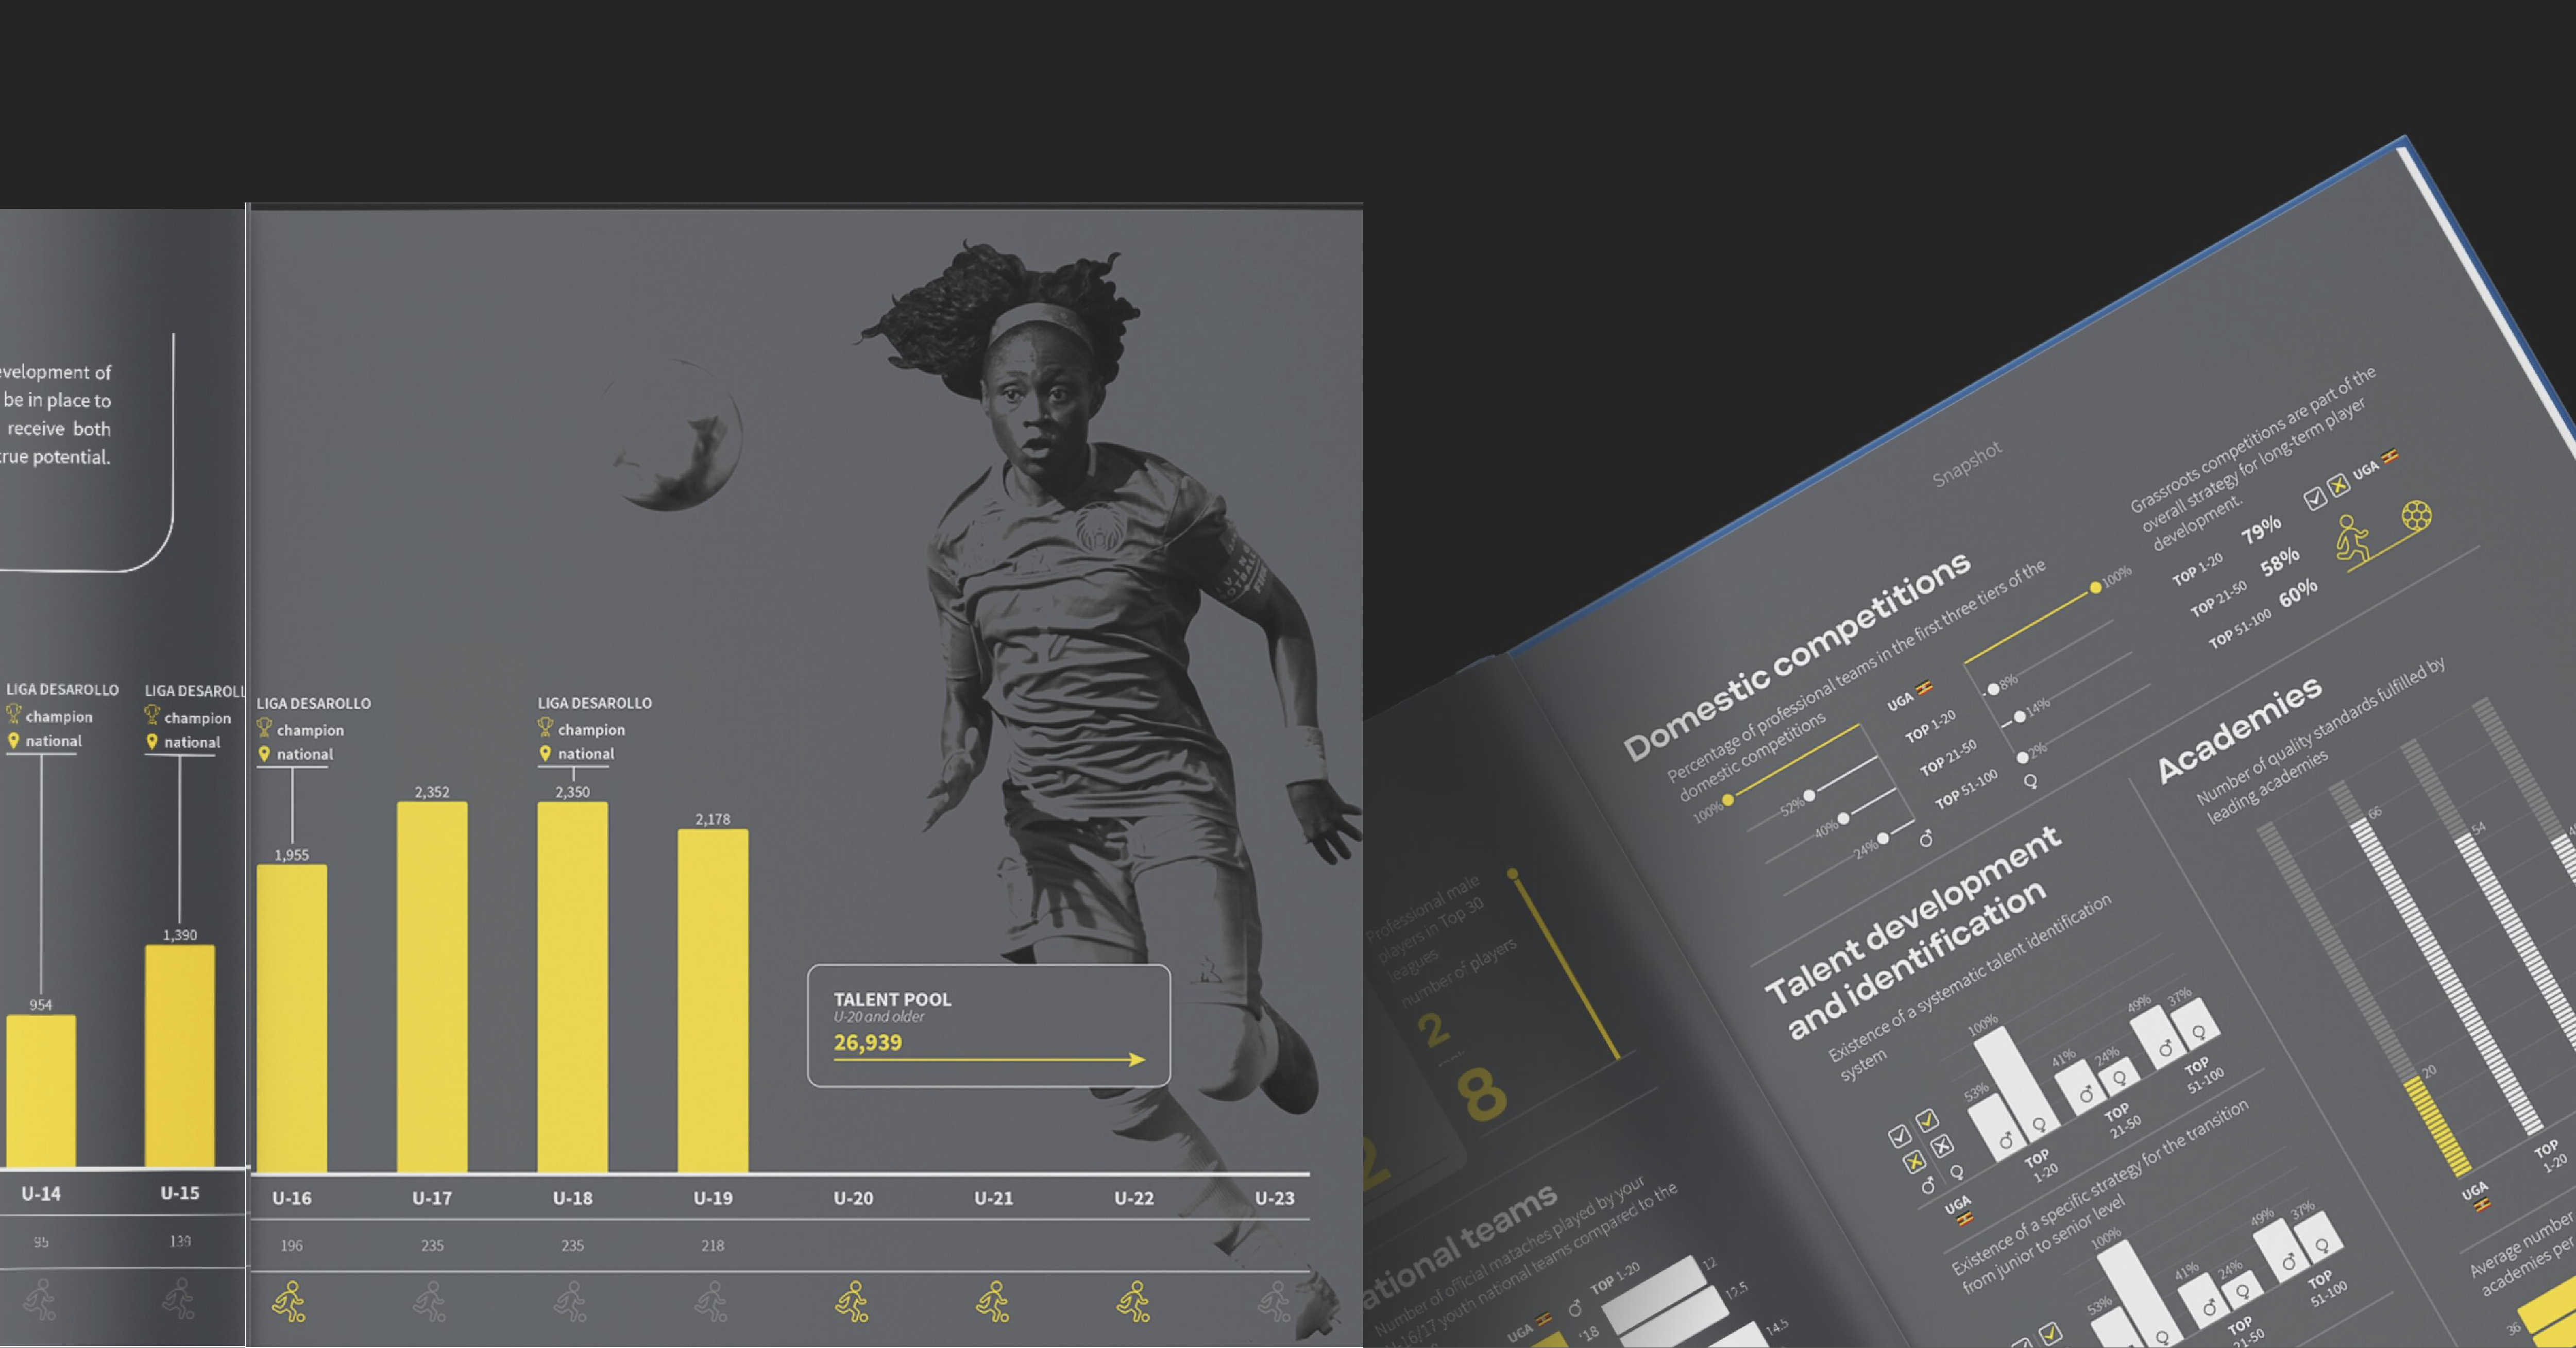
Jaaf Information Design Unleashing the Power of Clarity

Nestled in the Netherlands with its vibrant design scene, Jaaf Information Design stands out as a...

Read More

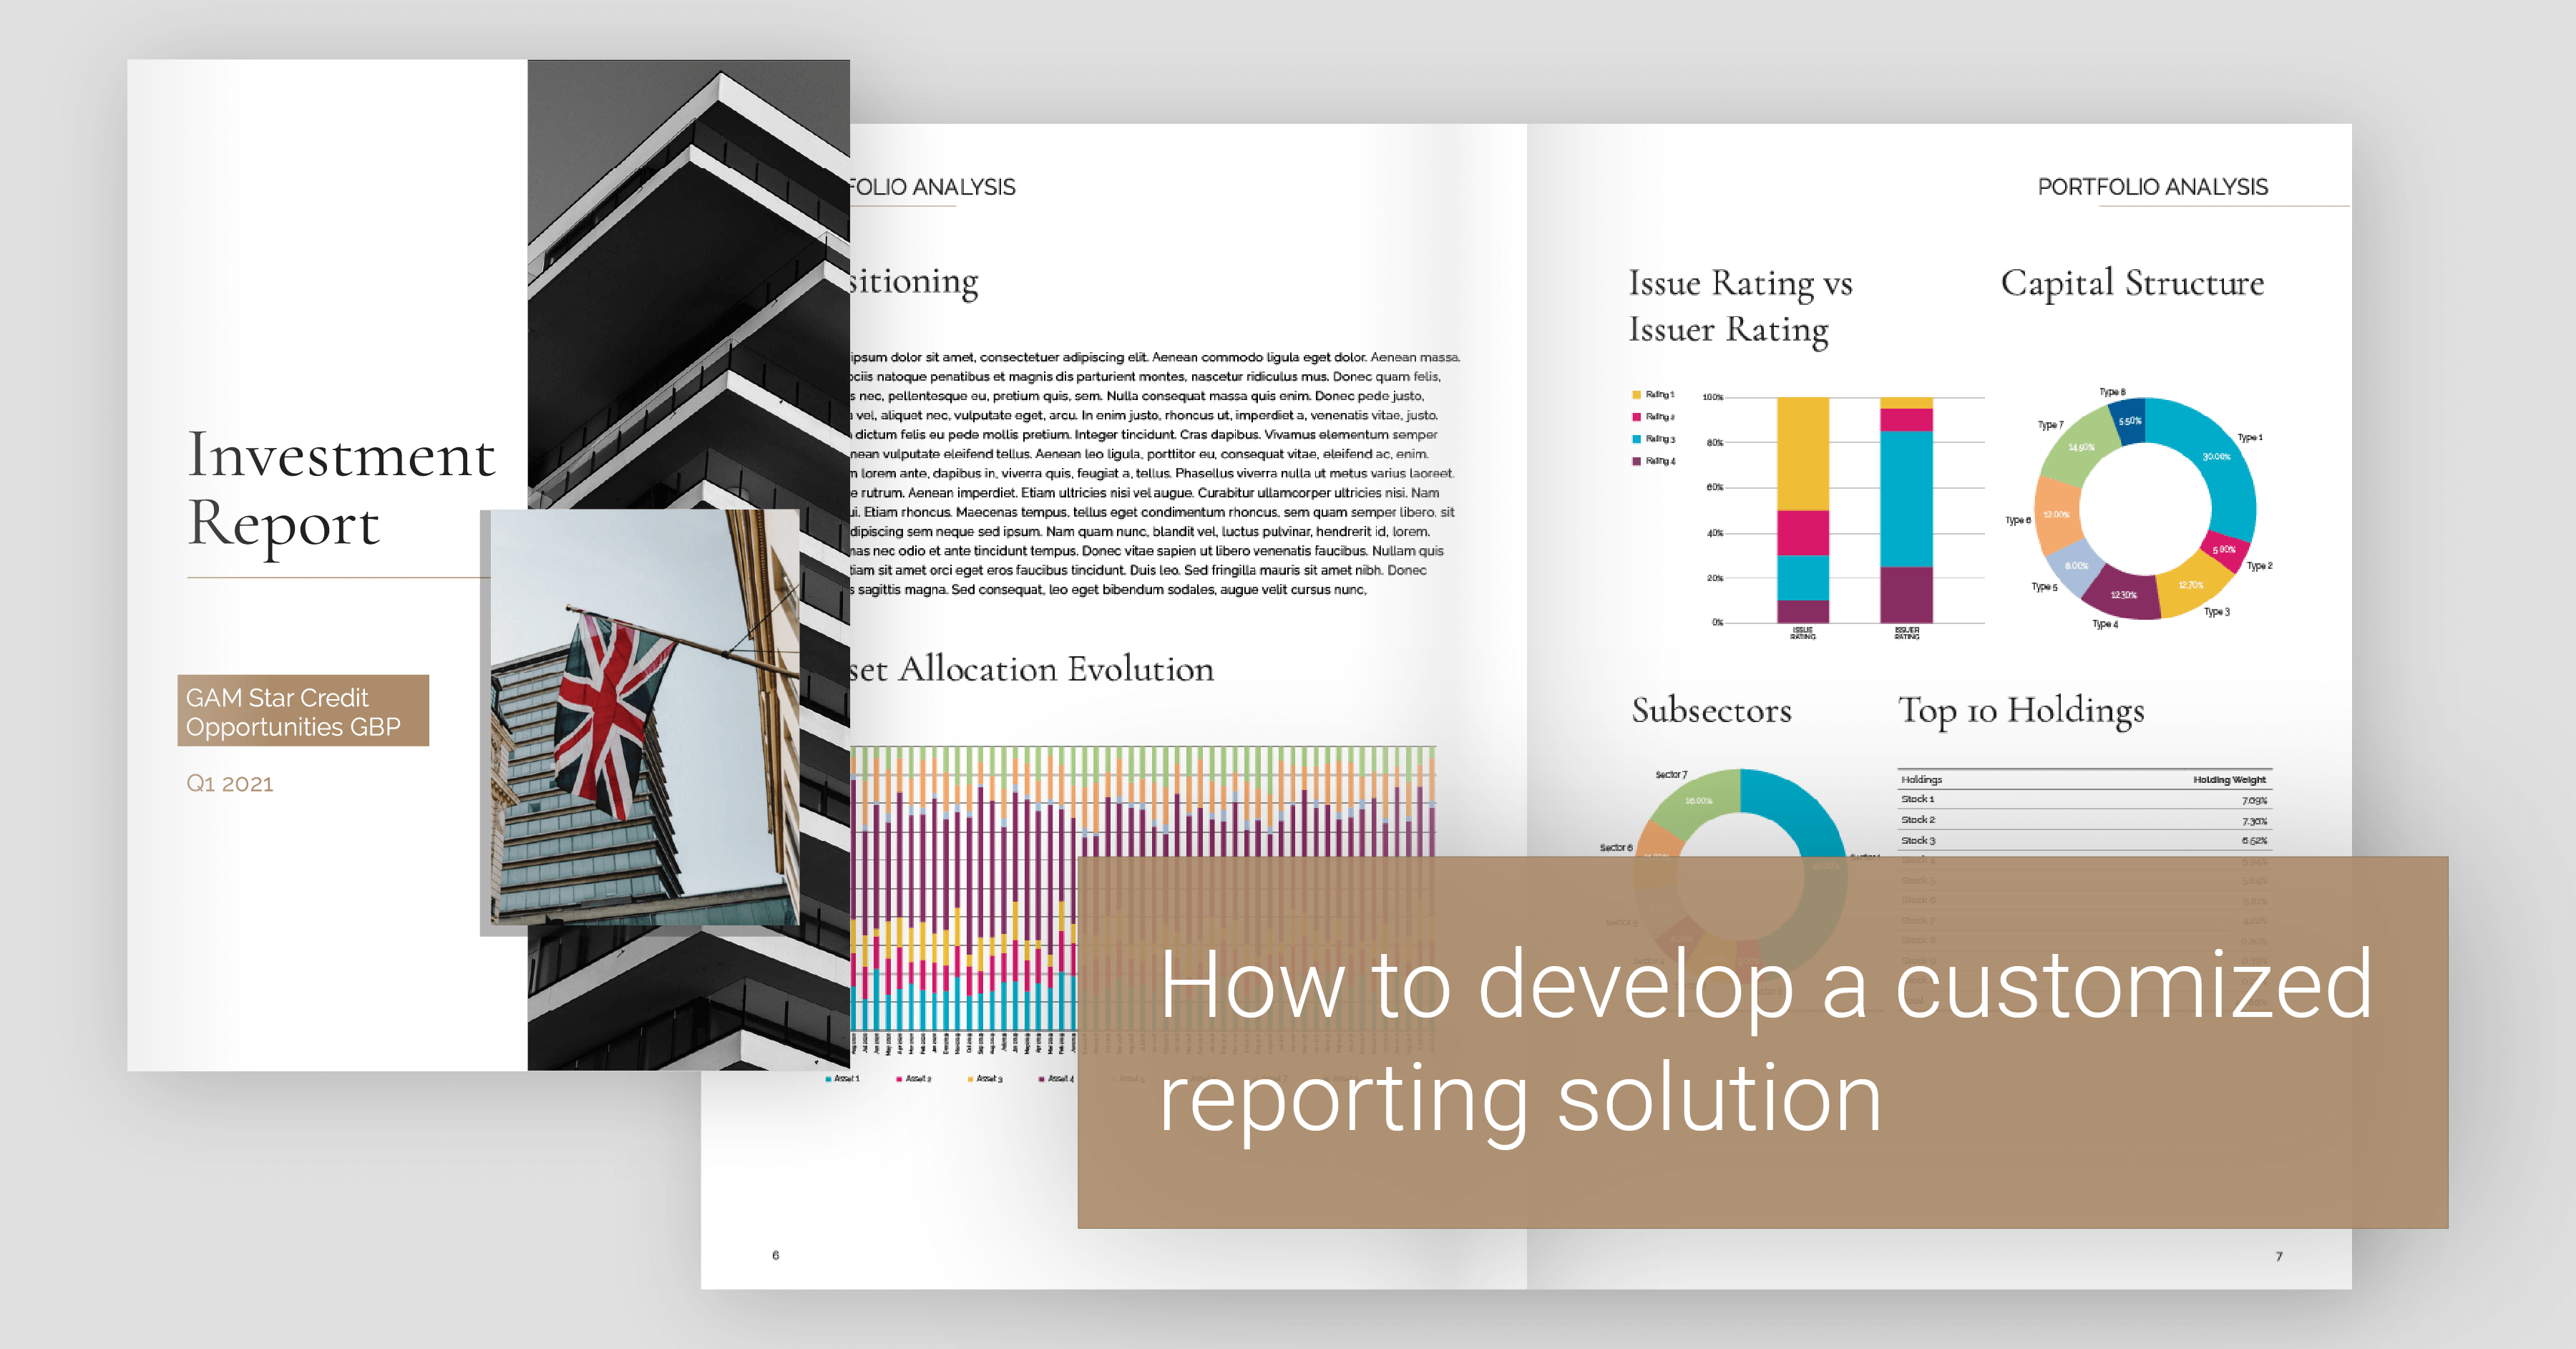
How L'Agence developed an outsourced customized reporting solution

L'AGENCE is a Swiss-based digital agency with a long-standing relationship with one of its main...

Read More

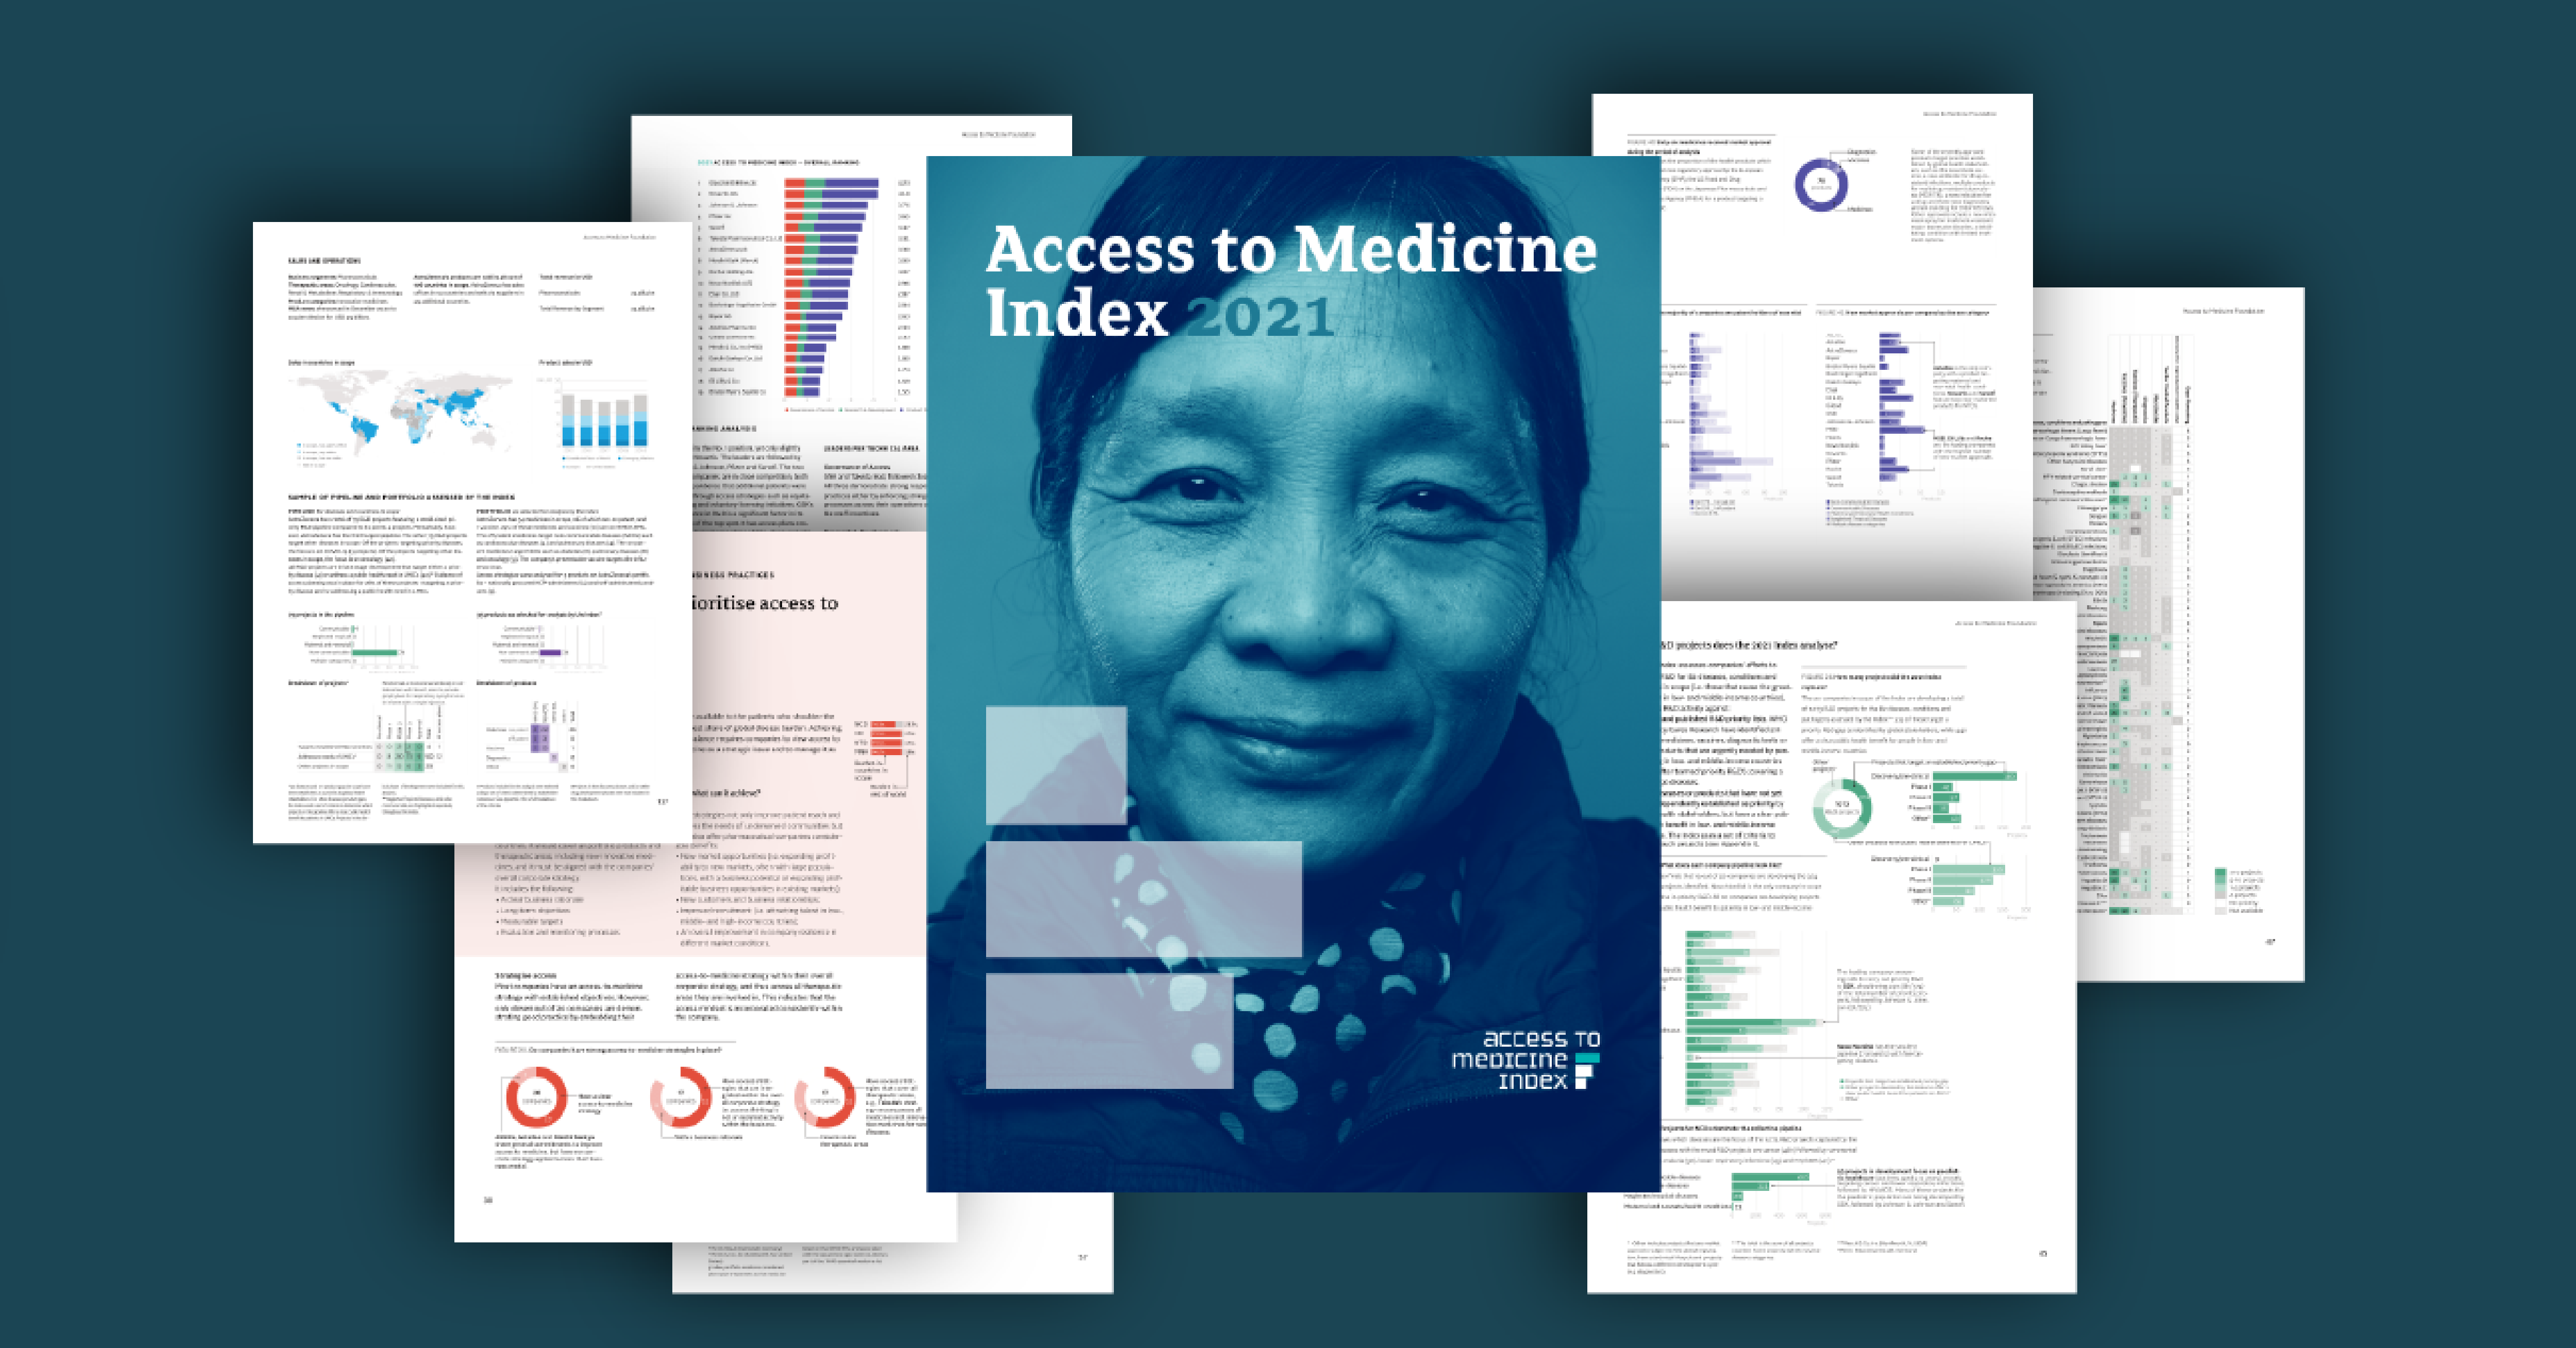
How Explanation Design uses Datylon to create a report with 250+ charts

The 2021 Access to Medicine Index report was published early last year and got a lot of worldwide...

Read More

Subscribe to our newsletter

Receive inspiration, practical advice, customer stories and news right in your mailbox. 

Newsletter

More histogram maker features

Enjoy full design freedom while greatly improving productivity. We believe that carefully designed histograms are essential to making an impact with data. Datylon gives you a histogram maker tool with powerful styling options.
Advanced styling options for charts such as colors and types

Advanced styling

Enjoy full freedom of design with our advanced styling options. Tweak all histogram elements to perfection.

Multiple templates to start creating a chart

Chart library

Use our histogram templates to get you started easily. 

Choosing form a different options of datasets for creating a data visualization

Efficient data management

Import, update and store the data in an organized way speeding up the histogram design process.

Exporting possibilities for different platforms and graphic editors

Design for every platform

Use your histograms in other applications and channels. Improve the impact of your communication.

Possibilities for collaboration by splitting design and data parts of data visualization among specialists

Re-use & collaborate

Save time and re-use or re-purpose histograms with new data. Discover how charts adapt automatically.

What is a histogram?

A histogram is a set of rectangles (bars or columns) that shows a distribution of numerical variables over a scale divided into bins. Each rectangle represents the accumulated value (a range) of the given bin.
 
A histogram is a type of chart that resembles a bar or a column chart. But for the visual distinction between a histogram and a bar chart, it’s customary not to leave gaps (or to make them very small) between rectangles in a histogram to show the continuous nature of the variables used in the visualization. the columns have different heights because they correspond to the frequency of each group - meaning, how many items fall in a certain range.


datylon-graph-maker-distribution

Histograms are a powerful for showing distribution data. Like bar charts among comparison chart, histograms are the most easy-to-read chart among distribution charts. Histograms considered a go-to option for visualizing distribution. They allow to see the form of distribtuion really quickly.

Master the art of data visualization

Leverage our experts' latest tips and best practices to create impactful visuals. Discover fresh techniques to unlock your data's potential.

The Ultimate Double Materiality Chart

In Part 2 of this educational guide, we identified key best practices for designing an effective...

Read More

Real-world Double Materiality Chart Examples

Now that we’ve introduced in Part 1 the concept of double materiality, how it’s measured, and why...
Read More

Understanding Double Materiality with Impactful Charts

At Datylon, we’ve become increasingly passionate about ESG reporting over the past few years—not...
Read More

Datylon vs Power BI for automated reporting

In the dynamic landscape of business intelligence, Datylon and Power BI stand out as premier tools...

Read More

Subscribe to our newsletter

Receive inspiration, practical advice, customer stories and news right in your mailbox. 

Newsletter

Check our free and paid plans

DATYLON REPORT STUDIO PLAN

Create free histogram in an online editor

Datylon Report Studio is an online web application that allows to produce reports based on your on-brand templates. Powerful data management makes the process incredibly quick and easy. Allows to create unlimited designs and export them in svg, png or pdf format. 

DATYLON FOR ILLUSTRATOR PROFESSIONAL PLAN

Make histogram in Illustrator

Advanced data visualization right within Adobe® Illustrator®! Use our plug-in for Illustrator and boost your dataviz power with an extra set of unrivaled graph design features. Build histogram with the Datylon graph maker and add annotations, titles and illustrations using Adobe’s most powerful linework toolbox. Try it out for free with a 14-day trial.

DATYLON FOR ILLUSTRATOR PREMIUM PLAN

Advanced support and training

In addition to Datylon for Professional plan you'll receive an exclusive training sessions where our expert will guide you through the tool and help to unleash its full potential to maximize your results. Get your questions answered quickly with our one-day business day response to your support requests. No more waiting around – focus on what matters most, knowing our team is always here to back you up.

A picture of a customer success specialist

FAQ about our
histogram maker

Is Datylon histogram maker free?

Yes! If you want to create a histogram or any other type of chart or graph, you need to register on Datylon. Creating your account is free and only takes a few seconds. But if you would like to use our chart maker plug-in for Adobe Illustrator, you can try it for free for 14 days. Check the pricing here.

Learn more about the differences between our products here.

How to create a histogram?

It's very easy! If you want to create a. histogram online, you can create a free account on Datylon using this link. With your account, you're free to create any type of chart available. Click on "Create design" and find the chart type or chart template you're interested in. In this case, click on "Bar chart". You can also check our Help Center to learn more about how to create and style your histogram.

Can I share my histogram online?

Of course! When you create a new histogram design, by default it's private. You can then publish the design and add it to publications. Every publication can be shared and embedded online. Just right-click on your publication and generate the code.

Can I print my histogram?

Yes. Although you can export your histogram design as a PDF (or PNG) and print it, it probably is more common to print reports and bigger layouts containing multiple charts and graphs. For this, you might want to use our robust chart maker plug-in for Adobe Illustrator - Datylon for Illustrator. The plug-in supports CMYK color mode or spot colors enabling on-brand color consistency. Learn more about the color modes available here.

What if I want a different type of chart?

Then with Datylon, you're in good hands! Datylon chart maker offers 120+ chart templates. Scatter plot, bar graph, pie chart, heatmap, treemap, and many, many more chart types are available in Datylon! Our chart types are carefully crafted to give you the full power of expression. Use our chart templates to get you started easily and quickly. Create your own to become even more productive and stay on-brand.

Can you help me make a histogram?

Definitely! We're a bunch of data visualization experts ready to help you get started with our chart maker. As it is often with many online tools, at first the features of our chart maker might be overwhelming. There are different ways to get help. You can check our elaborate Help Center and see if your question can be answered there. If not, we're more than happy to show you around our tools and services! Use this link to schedule a free demo session!

Okay, but what about my privacy?

We take data security and privacy issues very seriously. Please check our privacy policy to learn more.

About data security:
If you save your data, charts or designs on Datylon's online platform (web app), it will belong only to your account and you will have full control over it. Your data is treated as confidential while Datylon keeps all online user data in secure servers.

If you publish a project on our web app, it can be accessed through a direct link with a unique ID. If you want to make sure nobody finds your visualizations, keep them unpublished and download them as PDFs, SVGs, or PNGs for private use.

Read more here.

Didn't find the answer? Check our FAQs.