Report Design, Reporting
Top 7 charting add-ons for Excel
For professionals working with Excel, the need for advanced charting and visualization...
Report Design, Dataviz Resources, Report Server, Automated Reporting
Support Your Executives: Optimize Reporting for Strategic Success
Executive reports are crucial for supporting decision-makers to quickly understand the most...
DataViz Best Practices, Report Design, Food For Thought, Reporting
Datylon vs Power BI for automated reporting
In the dynamic landscape of business intelligence, Datylon and Power BI stand out as premier tools...
Report Design, Dataviz Resources, Report Server, ESG Reporting
Operational vs. Progress ESG Reports: A Deep Dive
The urgency to address environmental, social, and governance challenges has propelled ESG...
Report Design, Dataviz Resources, Report Server, Automated Reporting
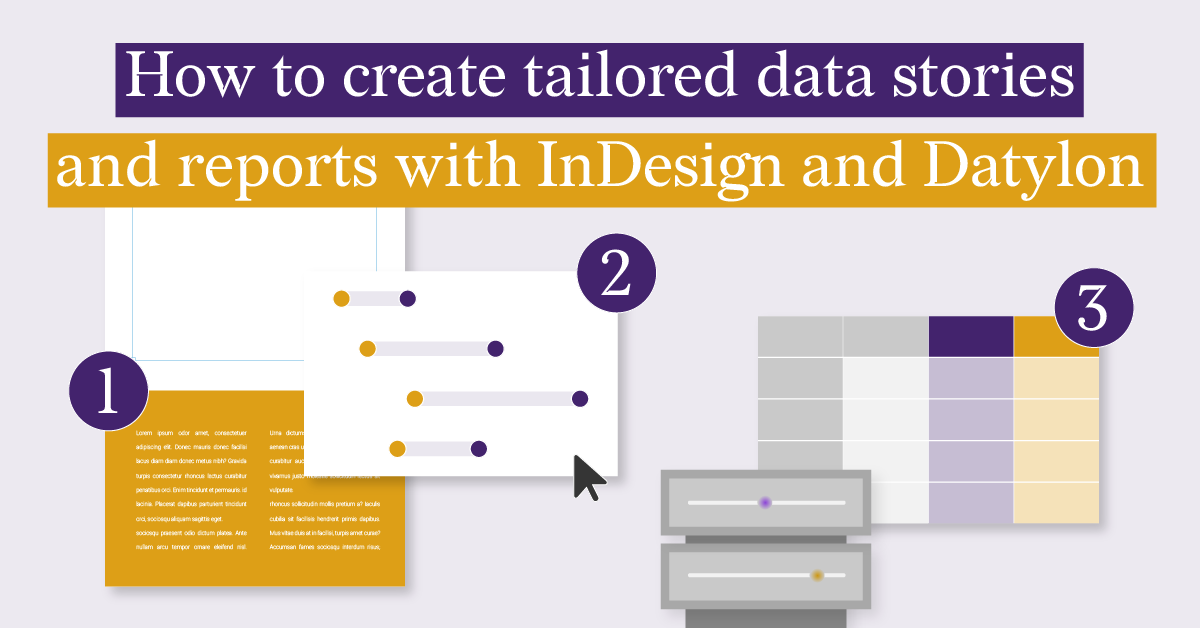
How to Create Tailored Data Stories and Reports with Indesign and Datylon
Are you tired of manually creating multiple versions of your data stories and reports? And what...
Report Design, Food For Thought, Report Server, Automated Reporting
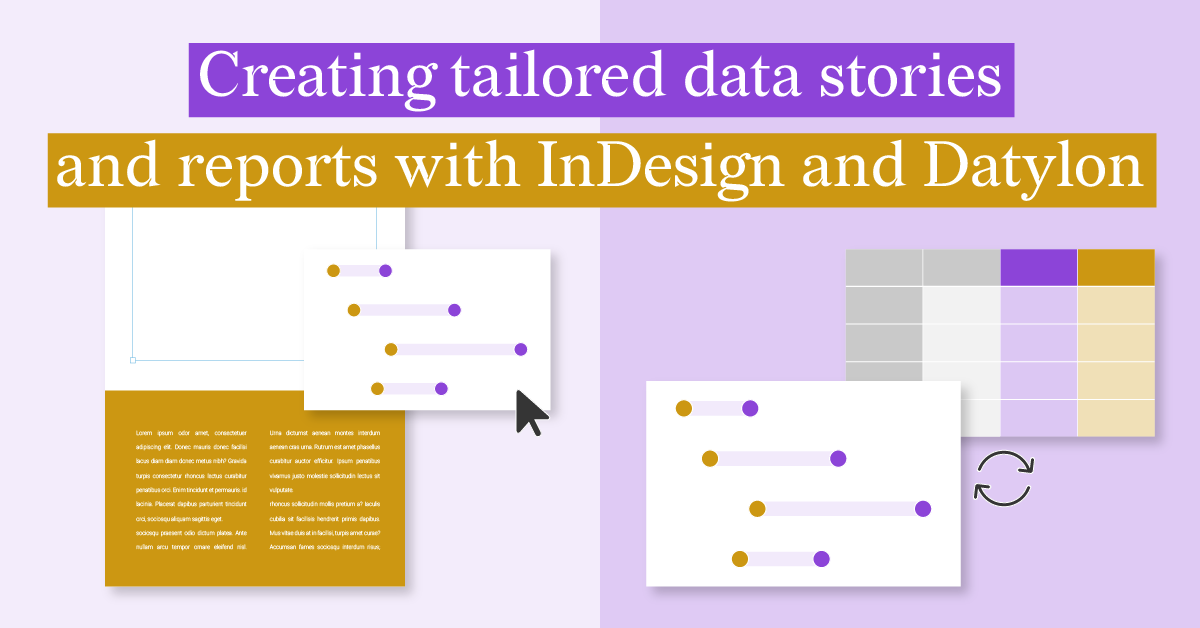
Creating Tailored Data Stories and Reports with InDesign and Datylon
Data-driven reports are essential tools for businesses seeking to make informed decisions and...
Report Design, Report Server, Reporting, Automated Reporting
What is automated data reporting? A complete guide
Almost everything in life has become data-driven. Businesses from various sectors have multitudes...
Report Design, Report Server, Reporting
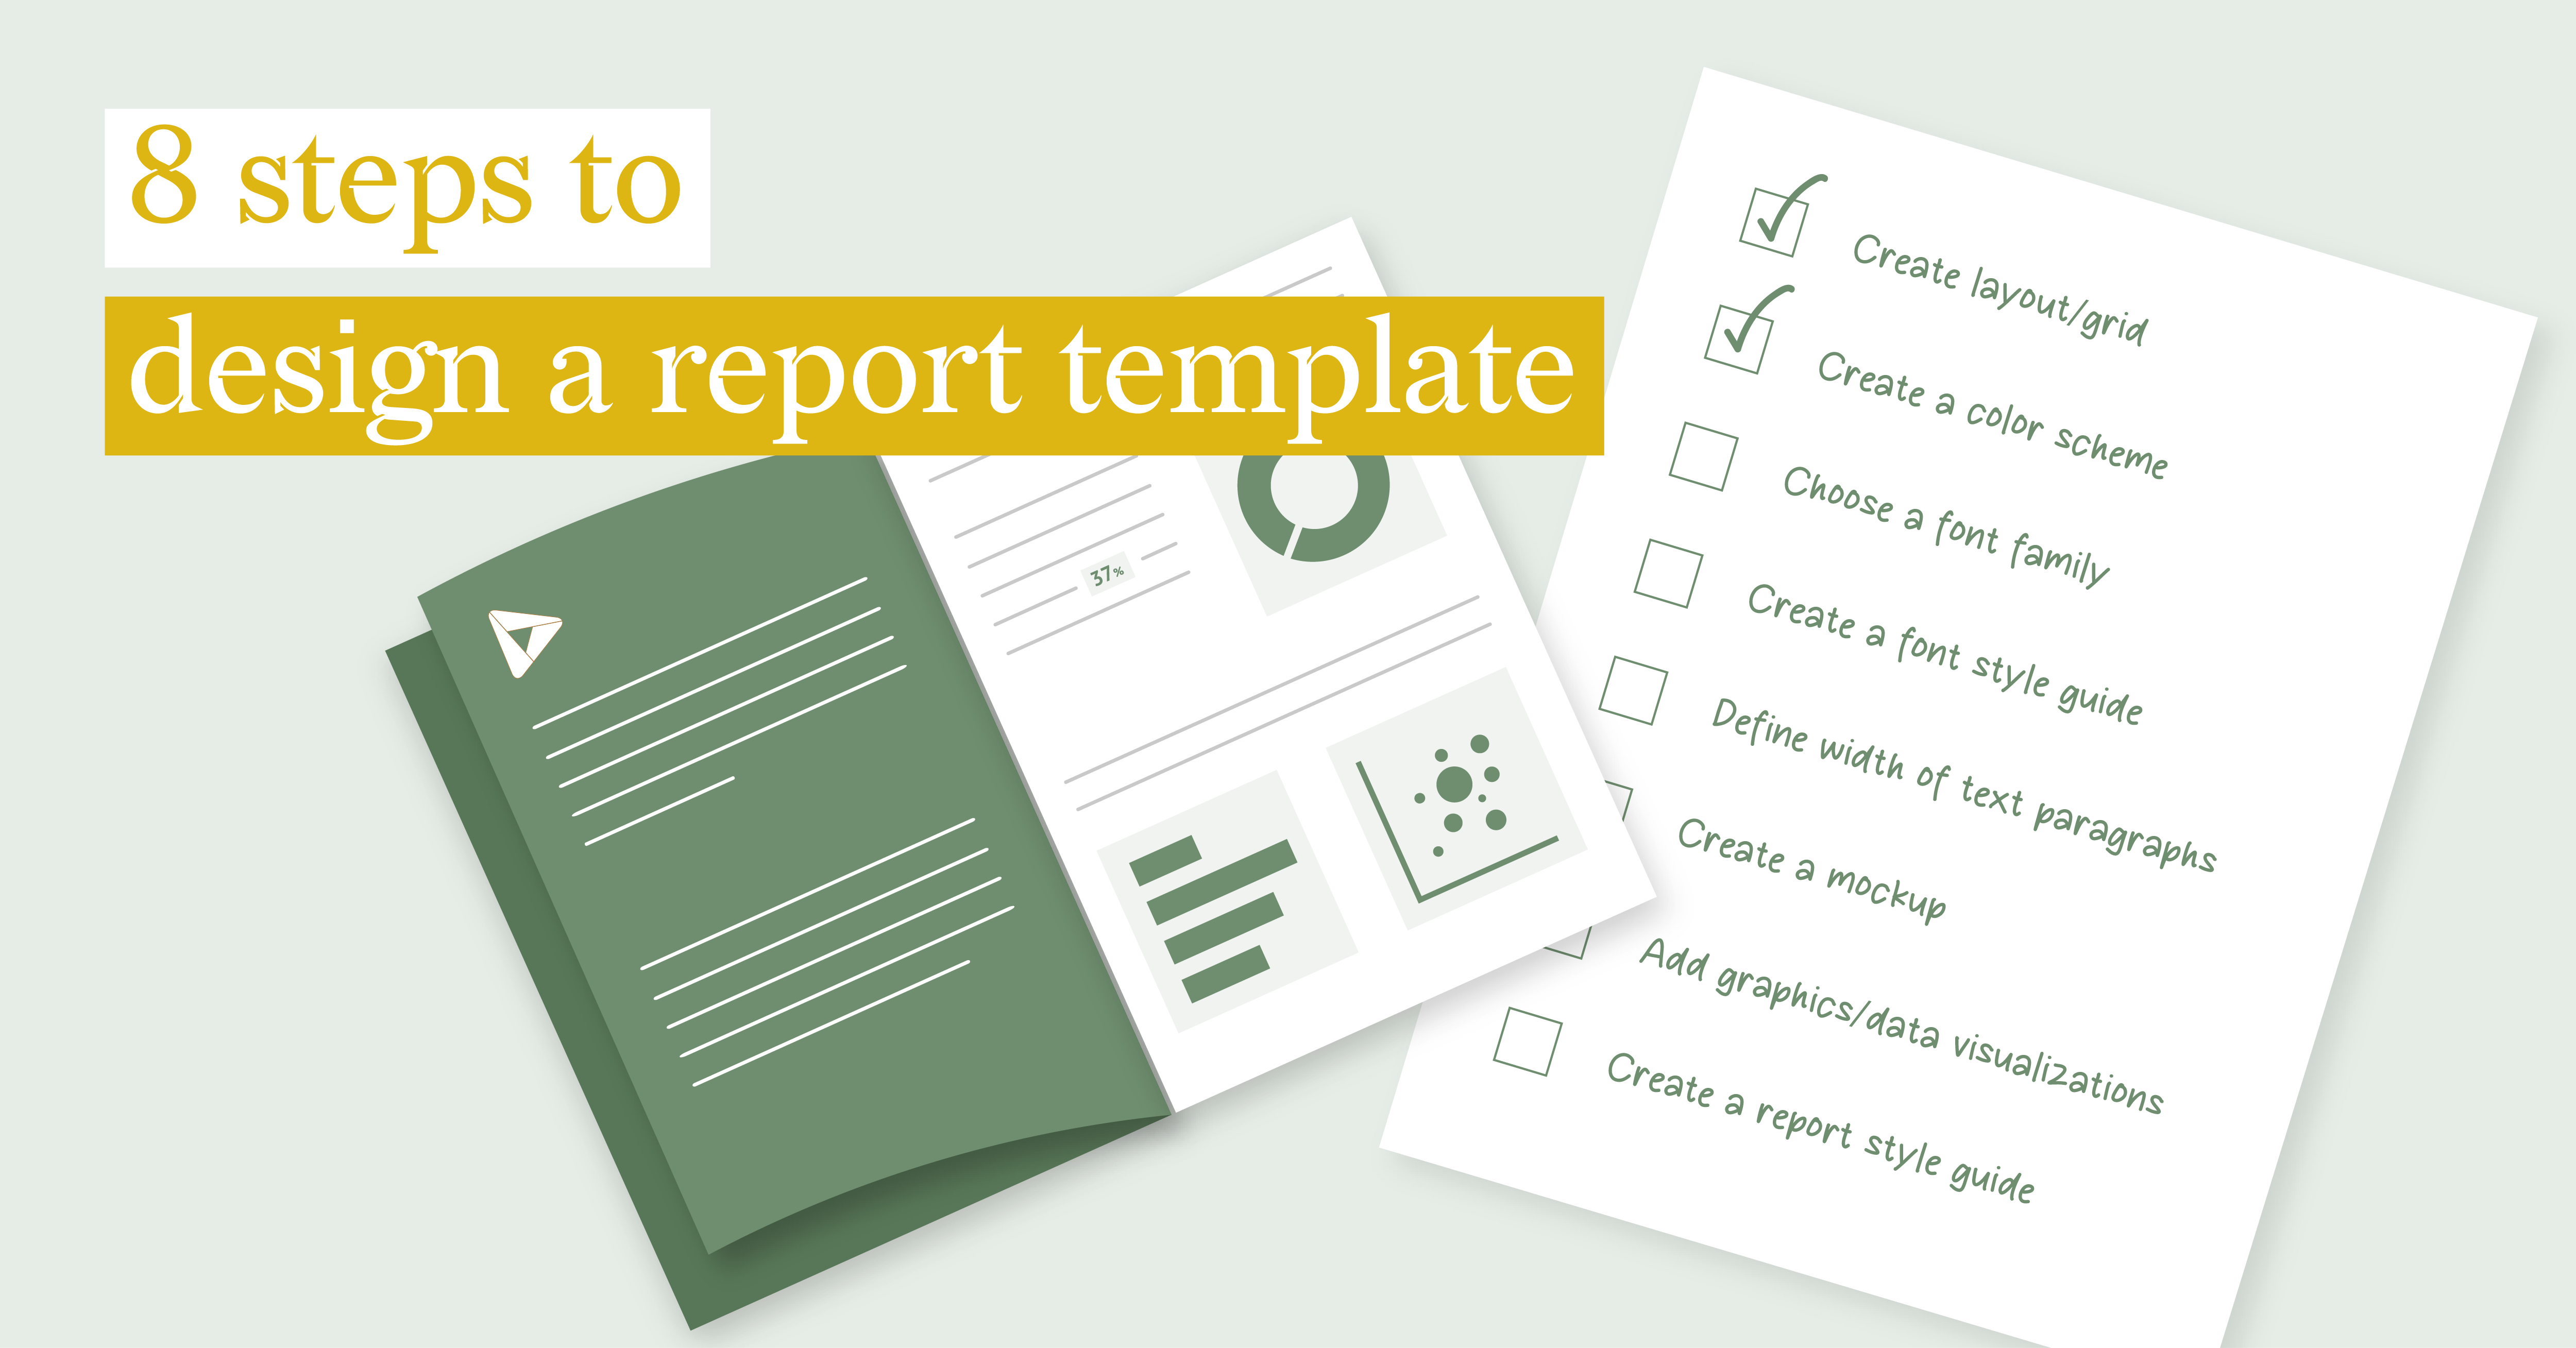
8 steps to design a report template
Designing and updating a recurring report can be a daunting task, consuming a significant amount of...
DataViz Best Practices, Report Design, Food For Thought, Reporting
How to use templates for embedded recurring reports: Blueprint
Embedded reports play a crucial role in today's data-driven business landscape. By embedding...
