DataViz Best Practices, Dataviz Resources, Reporting, ESG Reporting
Lessons from Leaders: Public ESG Report Examples
In today's world, investors and stakeholders are increasingly looking beyond financial...
Dataviz Resources, Report Server, Reporting, Automated Reporting
Future-proofing data visualizations: Designing automated design templates
Ever feel like you're drowning in data? Numbers everywhere, but no clear picture of what it all...
DataViz Best Practices, Technical, Product, Dataviz Resources
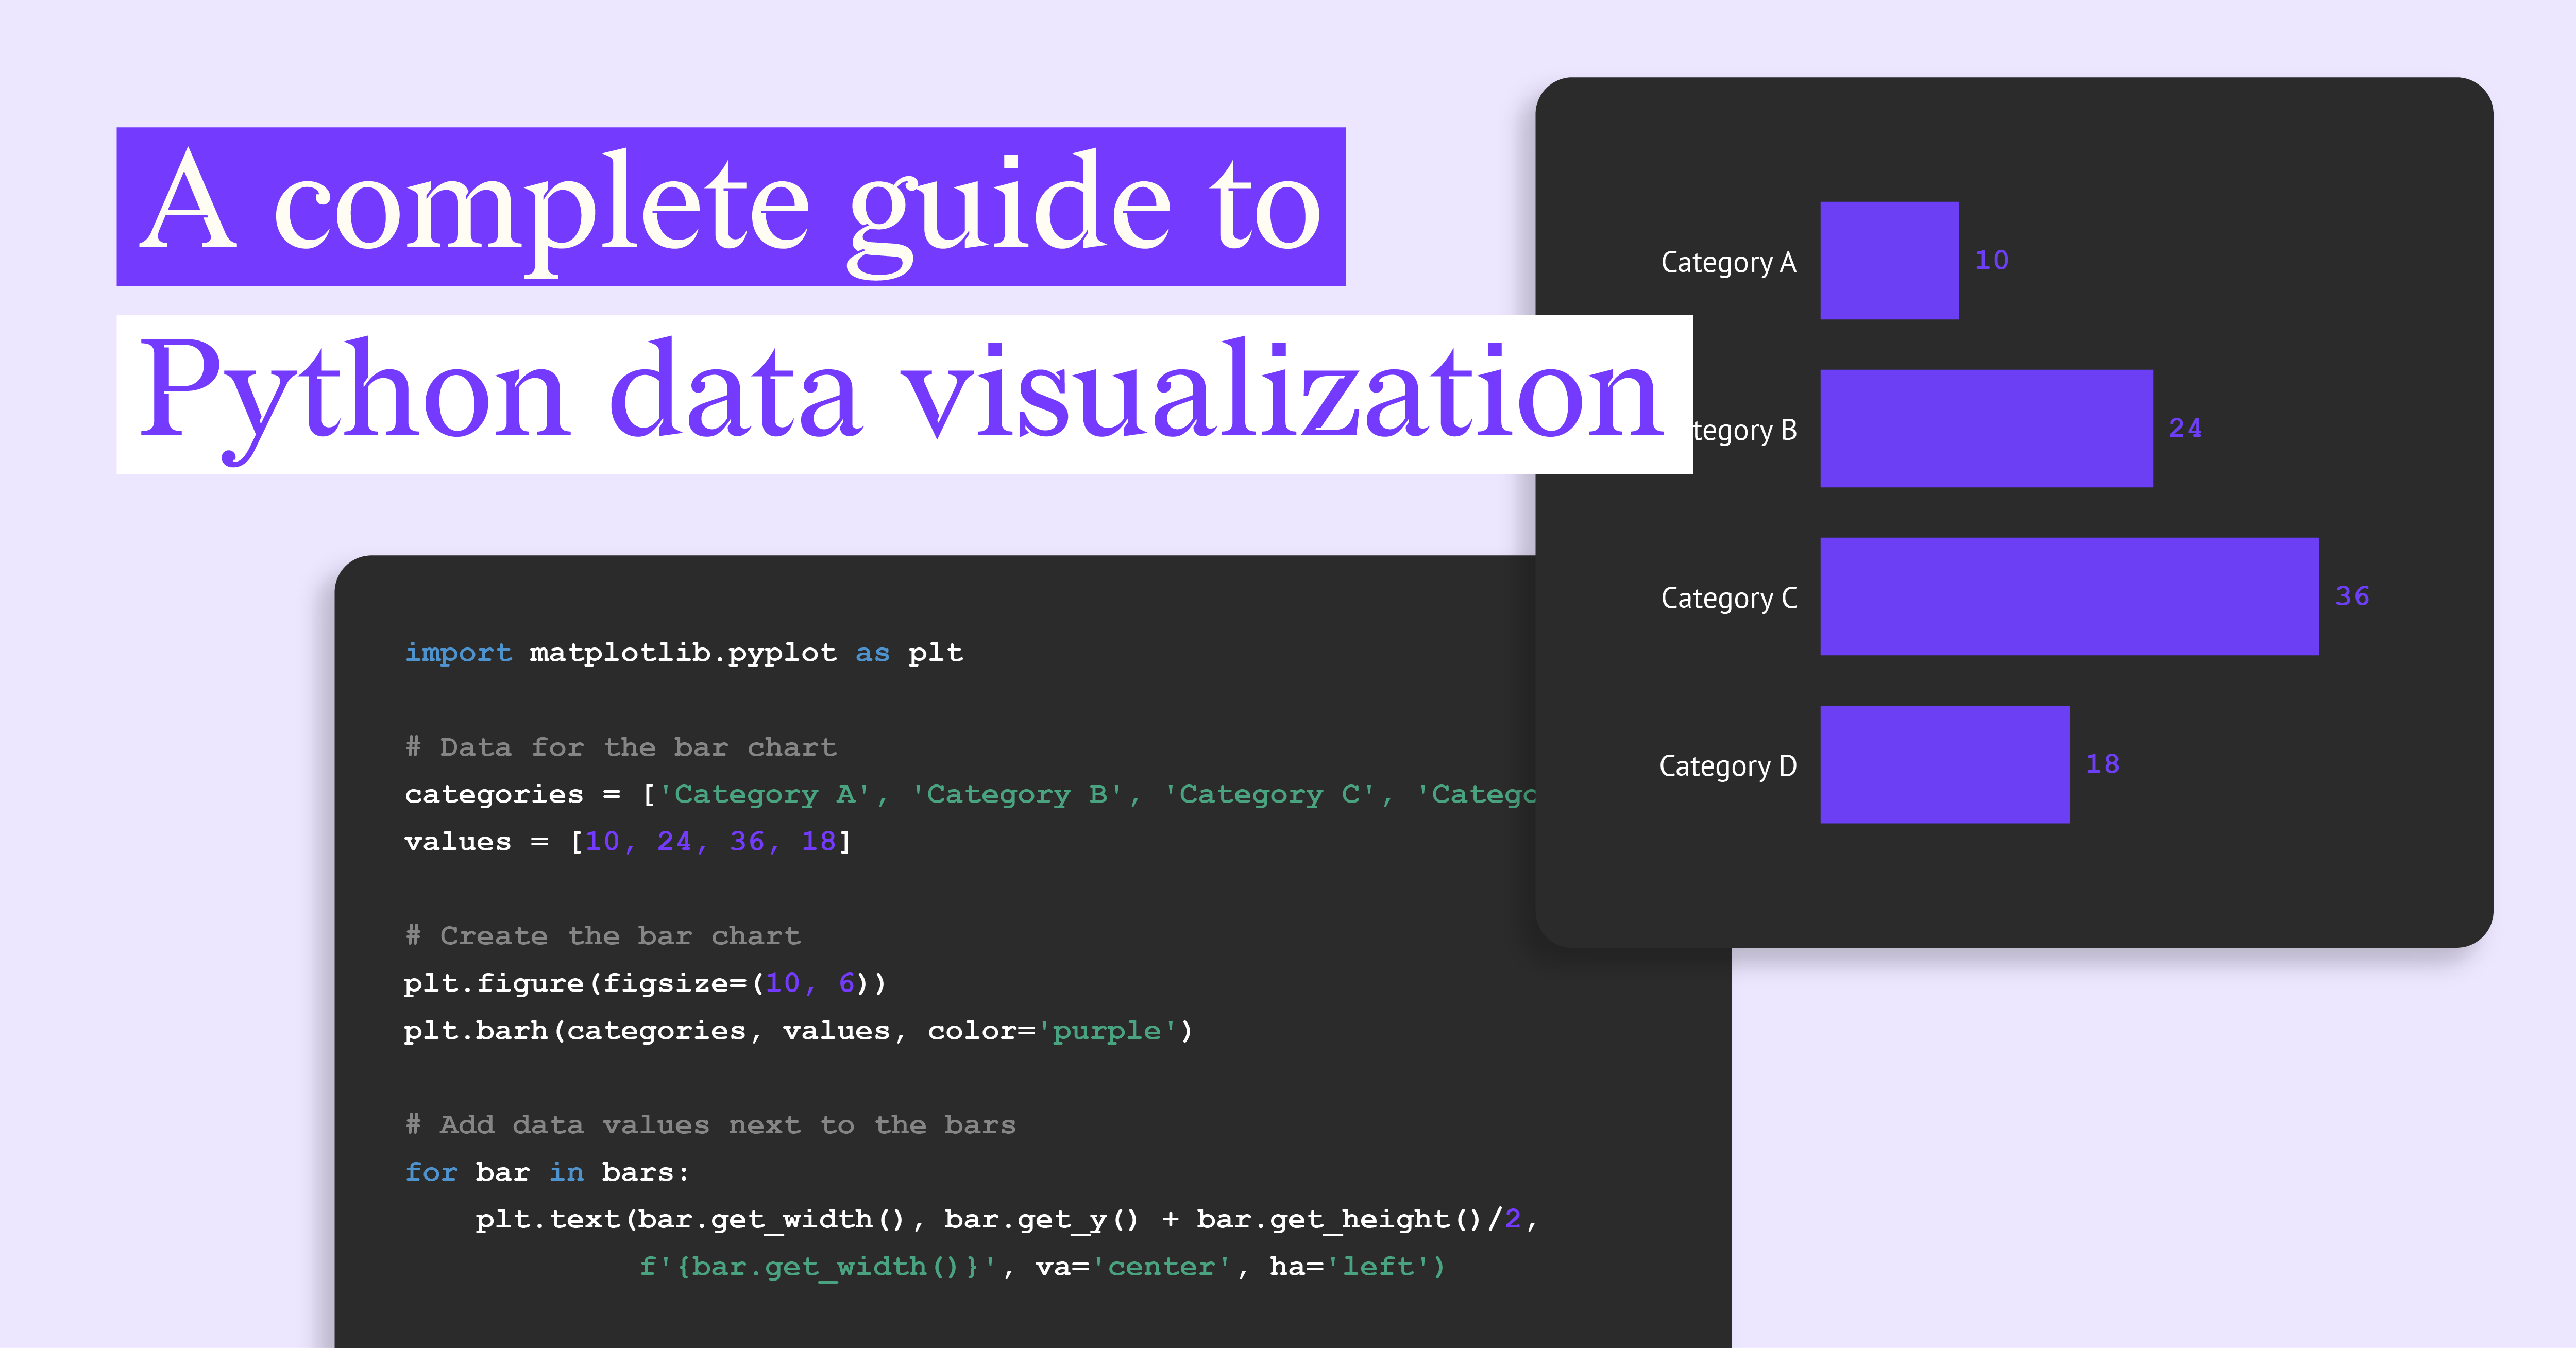
A Complete Guide to Python Data Visualization
Python data visualization has become a powerhouse in the world of data analytics. It offers...
DataViz Best Practices, Technical, Dataviz Resources
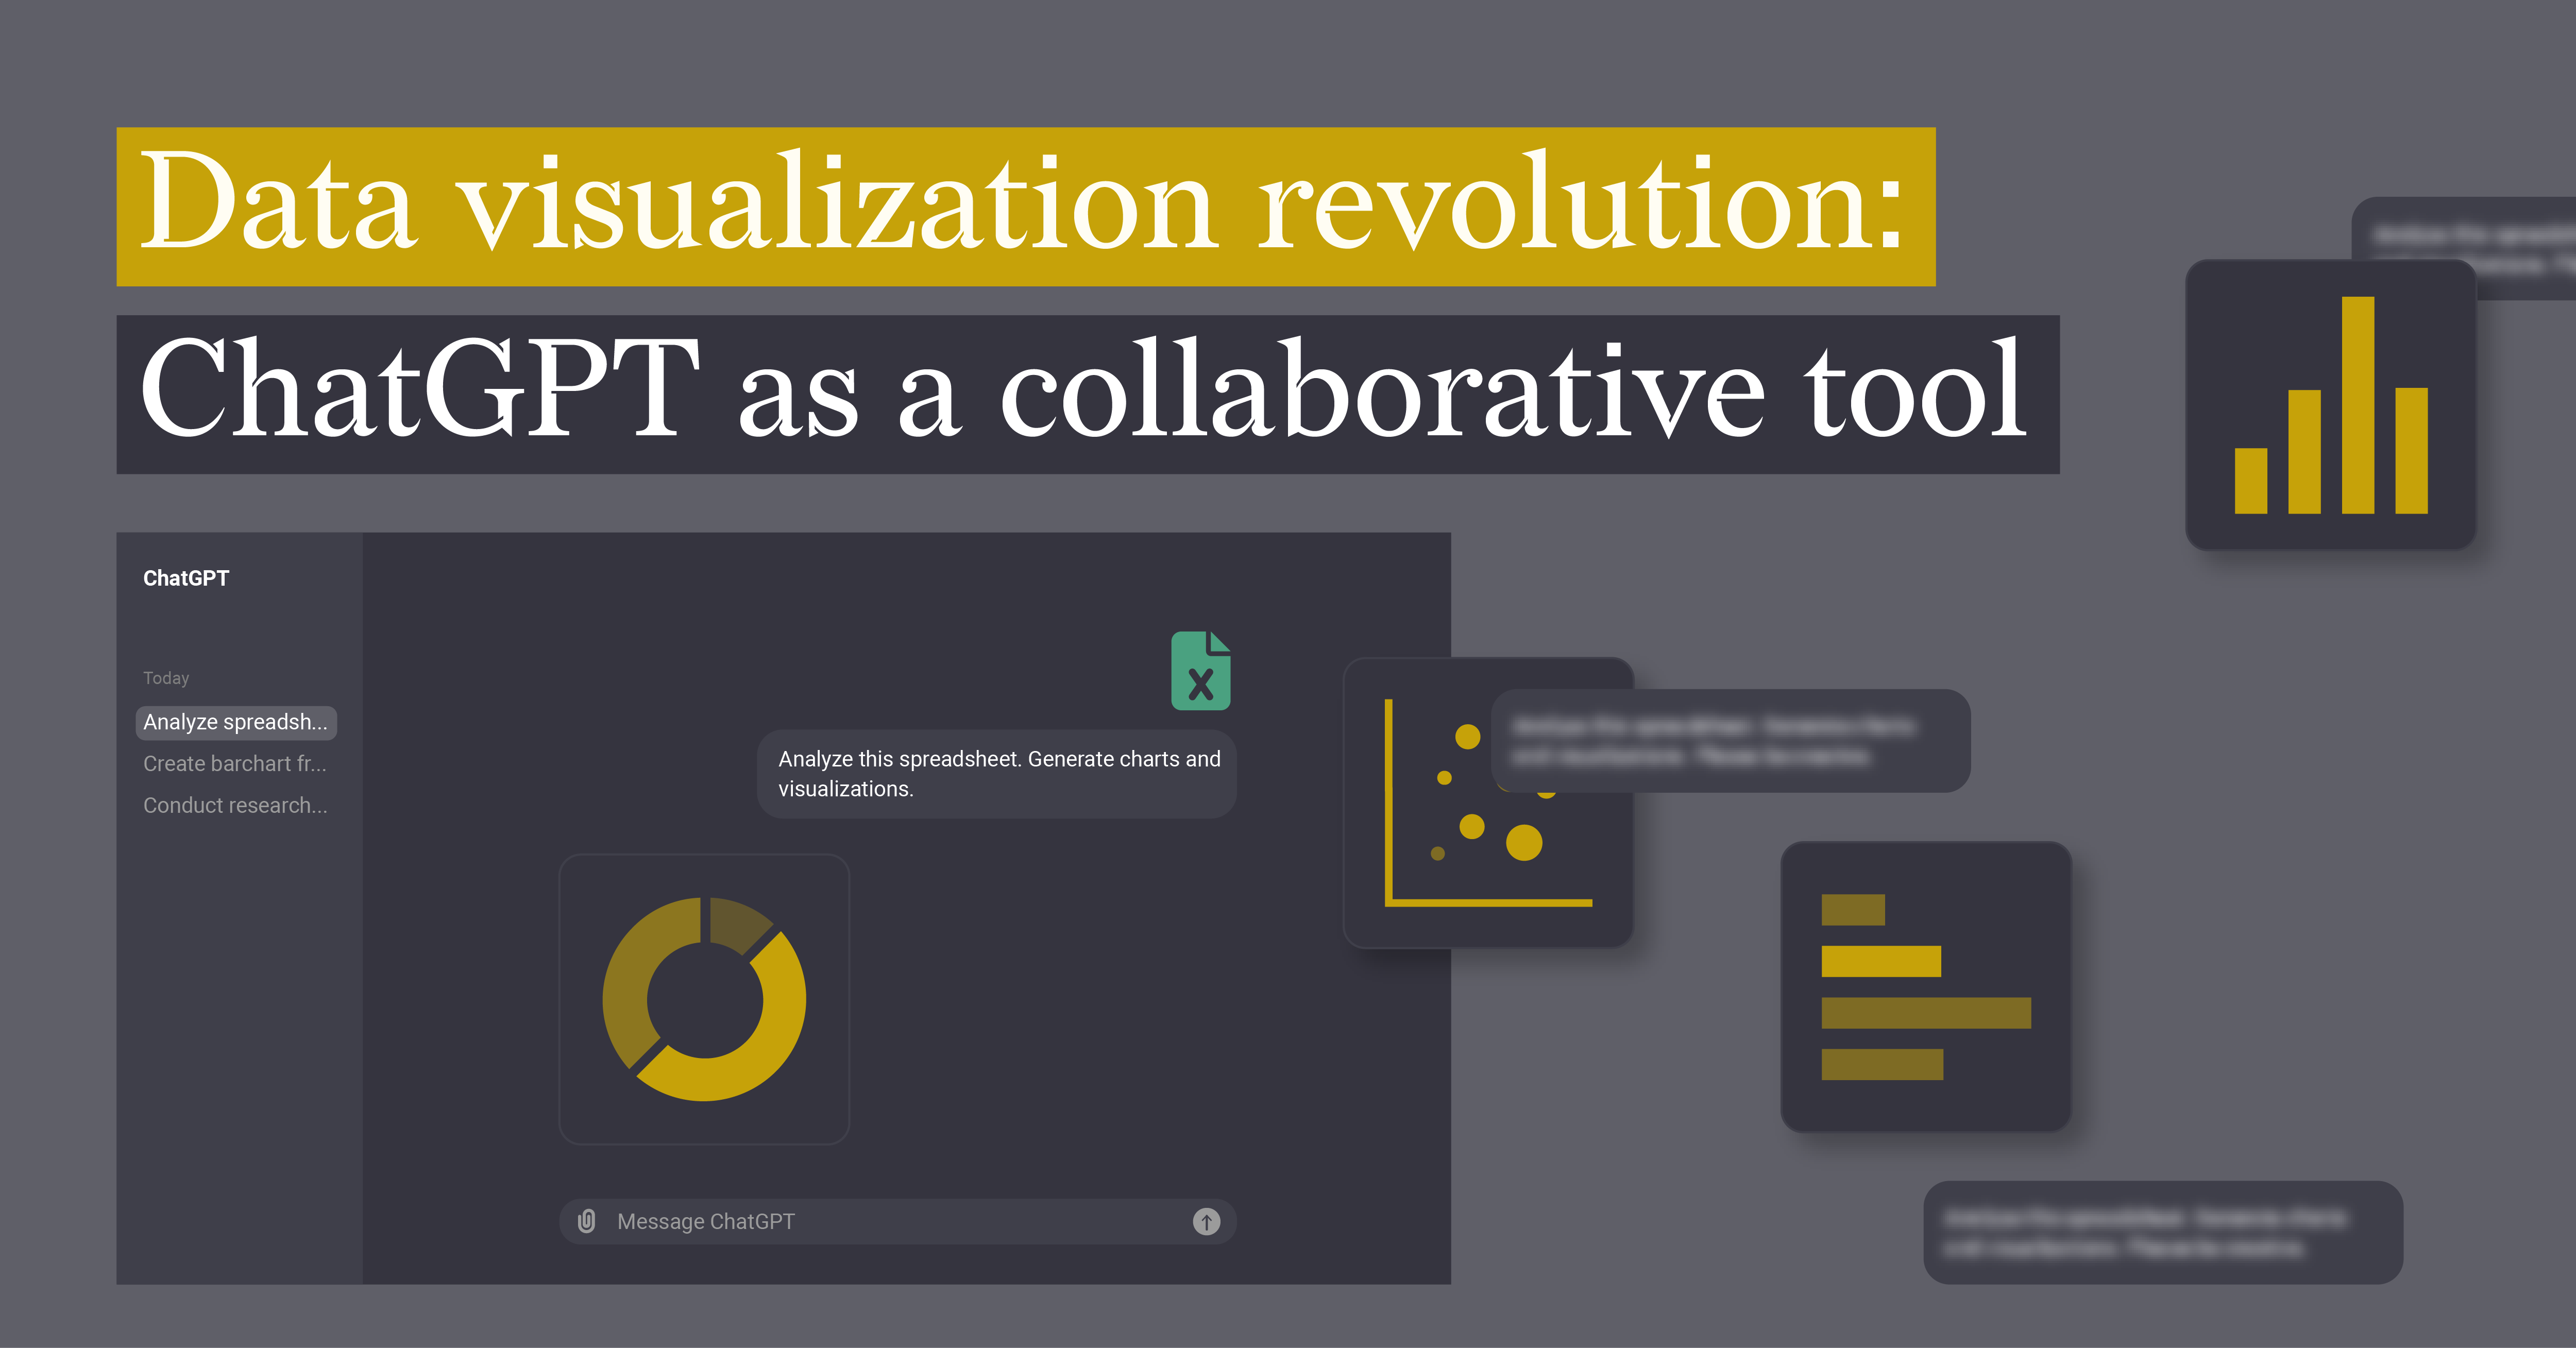
Data visualization revolution: ChatGPT as a collaborative tool
Want to transform your data into impactful visuals quickly and effortlessly? You spend hours...
DataViz Best Practices, Dataviz Resources
How Is Data Visualization Used In Government? Exploring Automated Solutions
How is data visualization used in government? They gather massive amounts of information on almost...
DataViz Best Practices, Dataviz Resources
The 5 Best Data Visualization Dashboards: Exploring Automated Reporting Solutions
An effective data visualization dashboard helps to promote quick decision-making by telling a...
Dataviz Resources
Which Data Visualization Tool Is Best For Dashboards?
Are you dealing with mountains of data but struggling to make sense of it? Data visualization is...
DataViz Best Practices, Dataviz Resources
What Is Interactive Data Visualization
Interactive data visualization (IDV) is using software to present and manipulate data visually. It...
DataViz Best Practices, Food For Thought, Dataviz Resources
5 Financial Data Visualization Techniques
Gone are the days of creating dry, monotonous reports. Financial data visualization techniques...
DataViz Best Practices, Food For Thought, Dataviz Resources
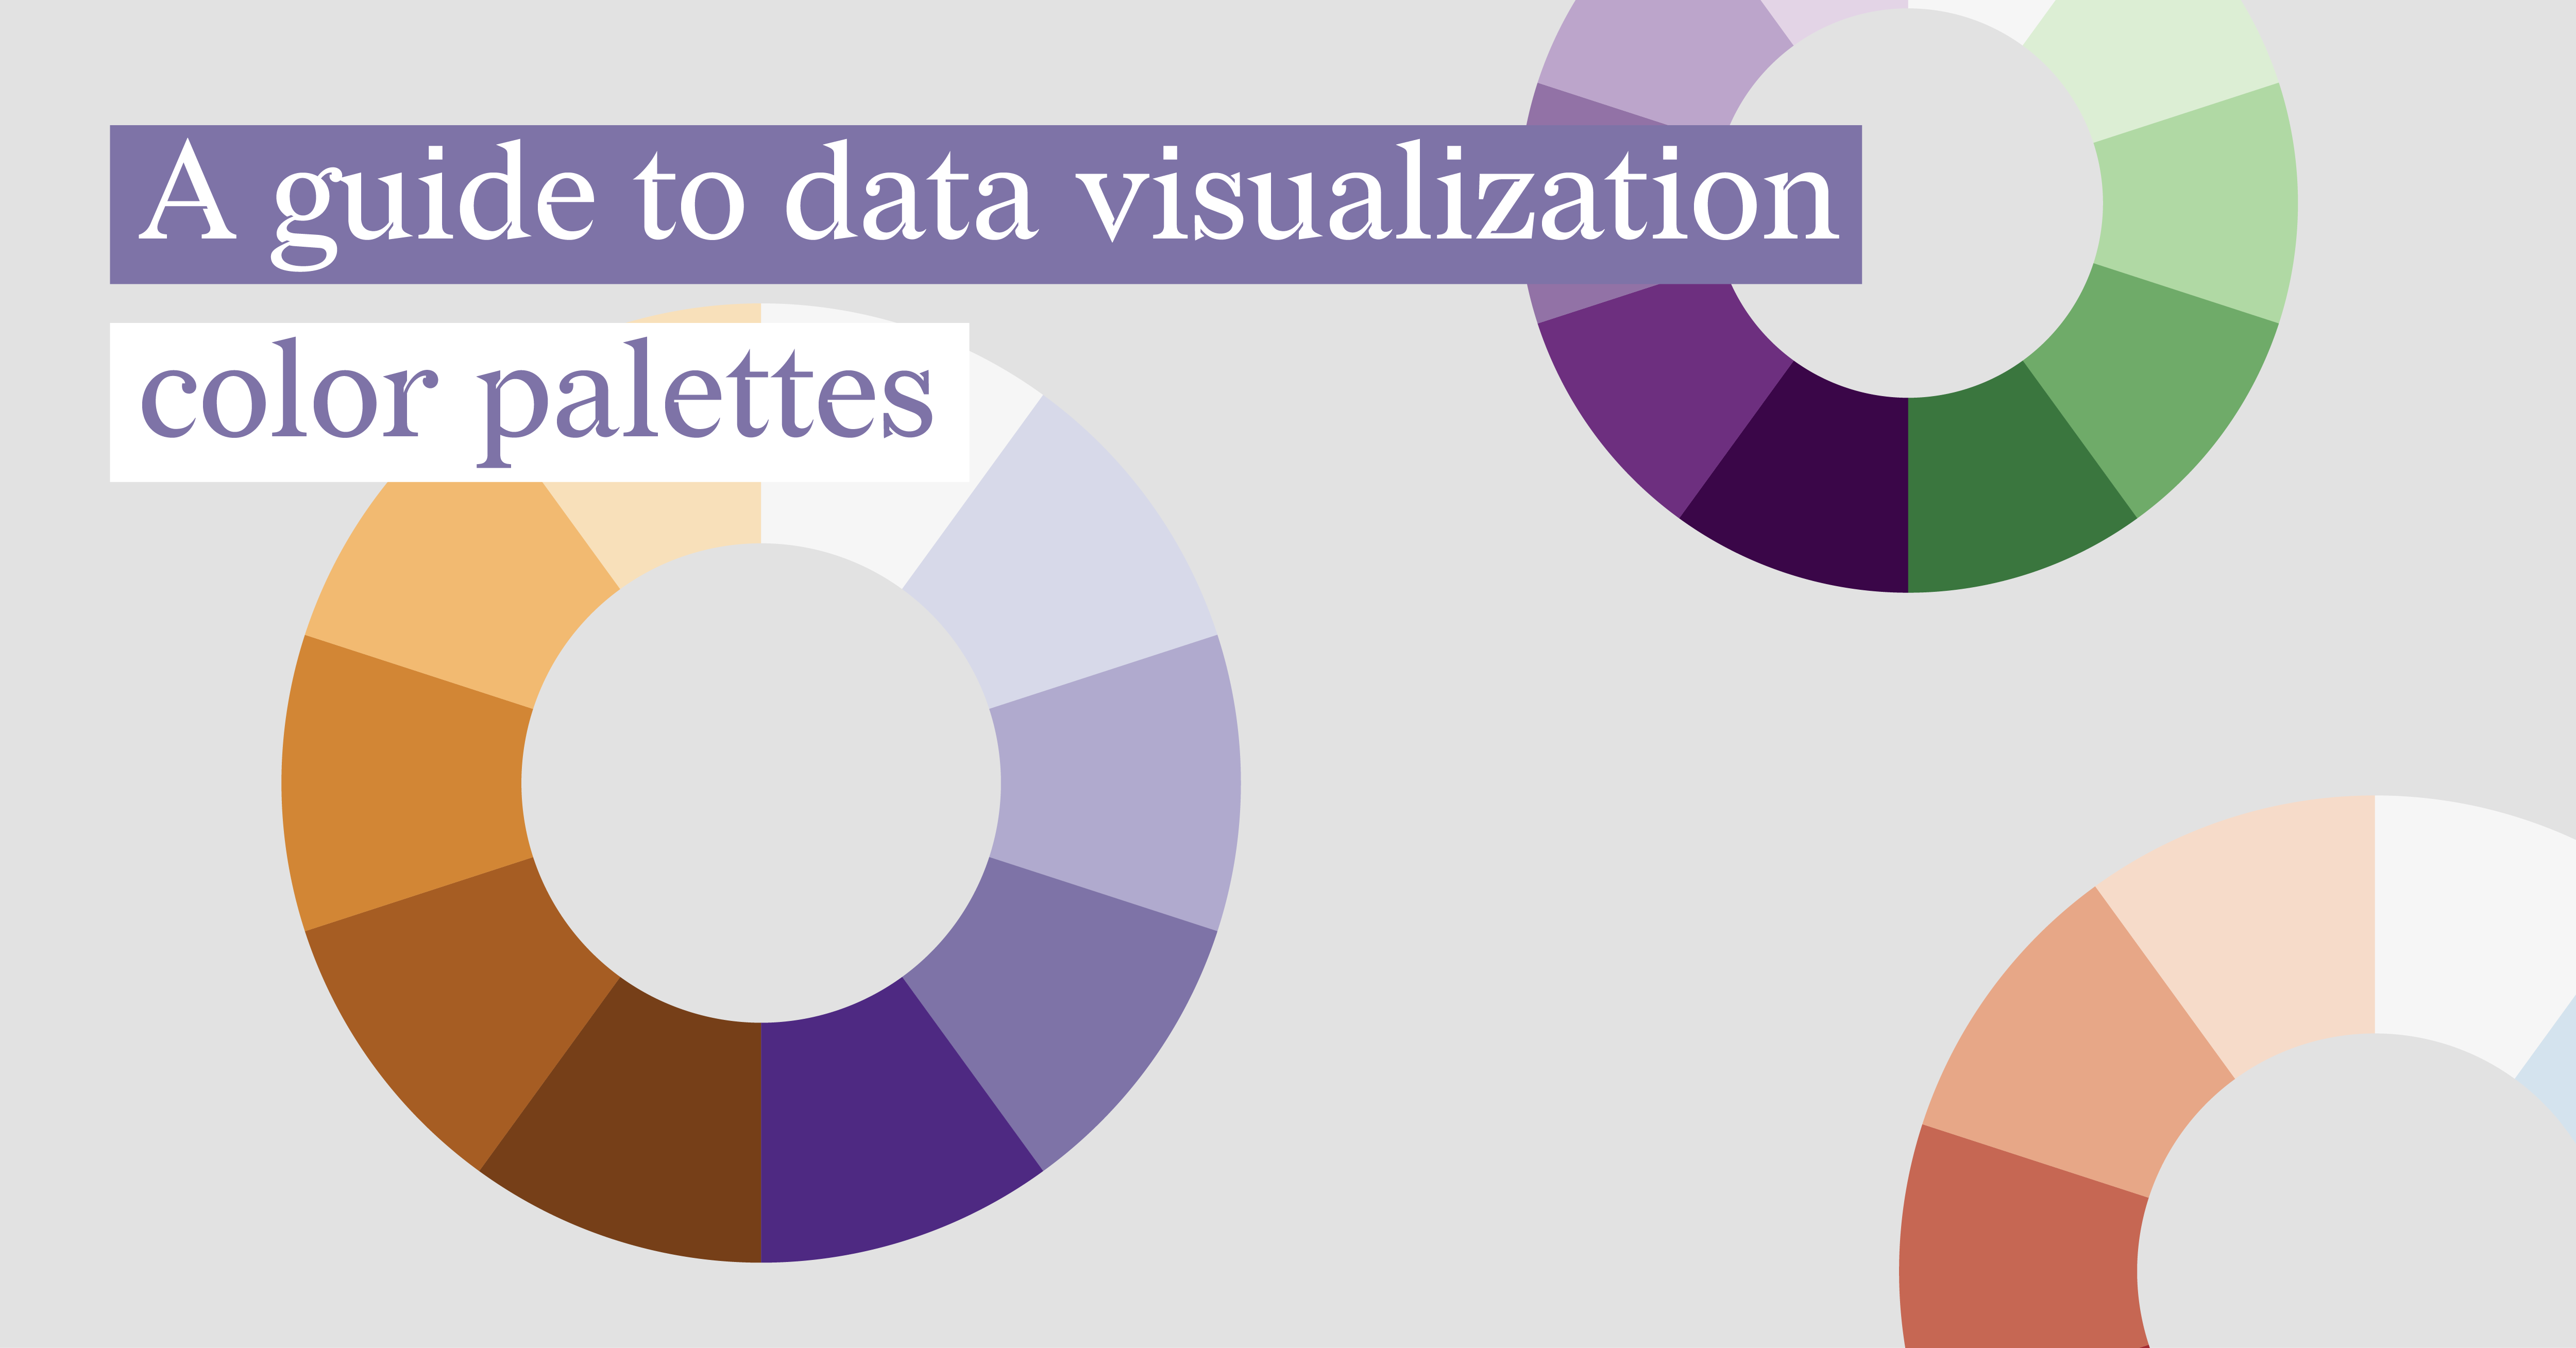
A Guide To Data Visualization Color Palettes
Did you know that your data visualization color palettes play a more crucial role than just...

