DataViz Best Practices, Financial Services, Dataviz Resources
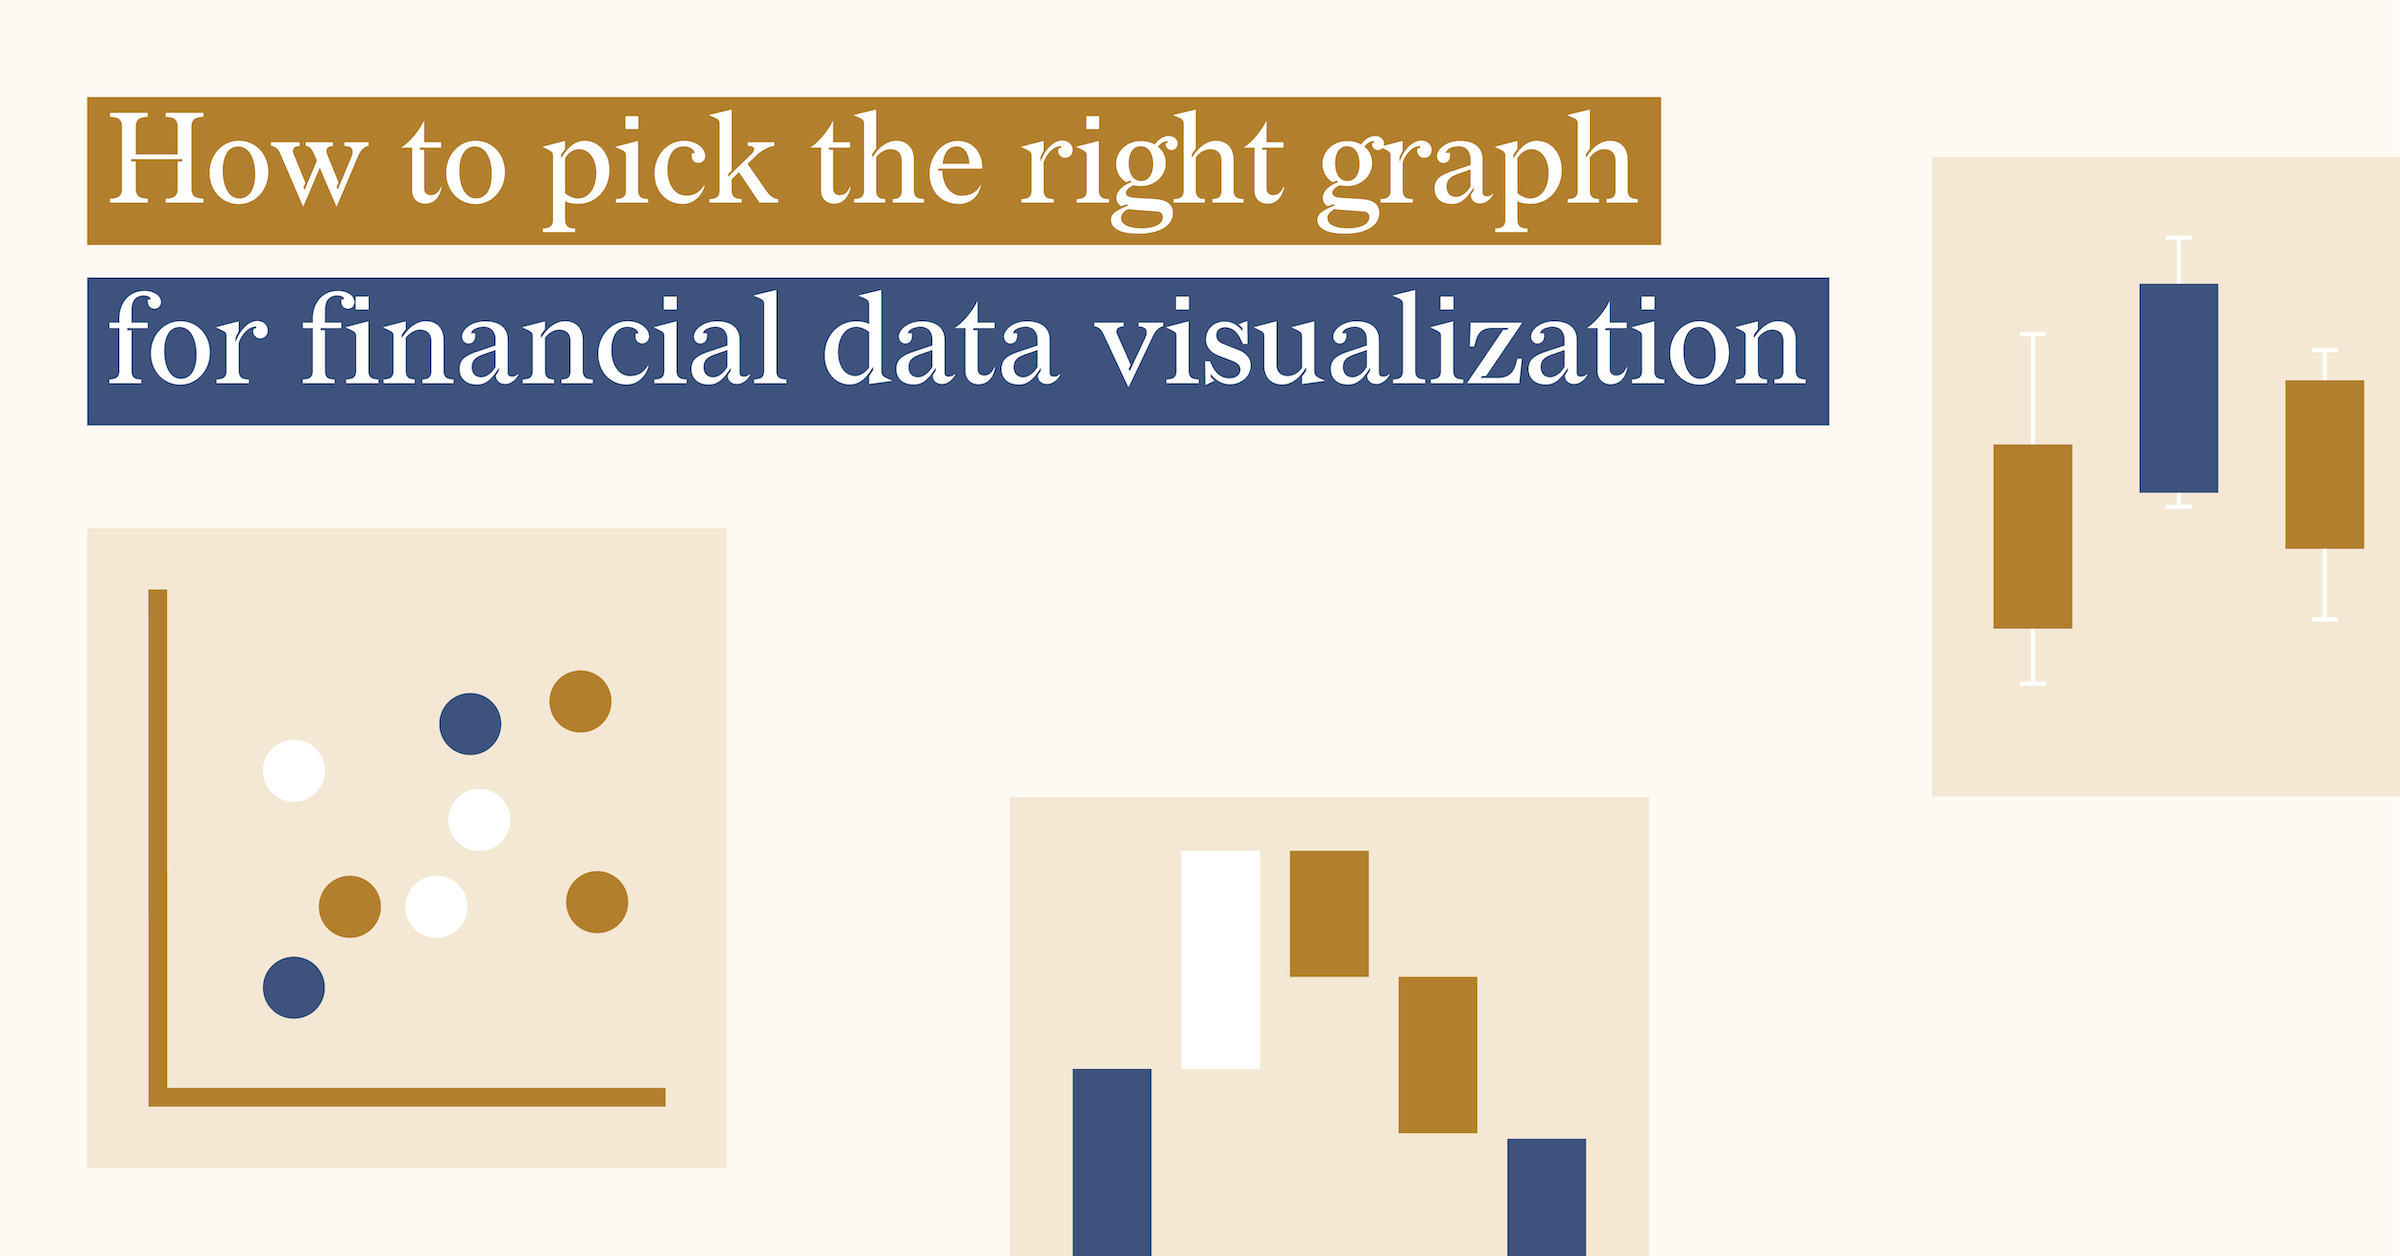
How to pick the right graph for financial data visualization
When it comes to selecting the right graph for financial data visualization, it's important to...
DataViz Best Practices
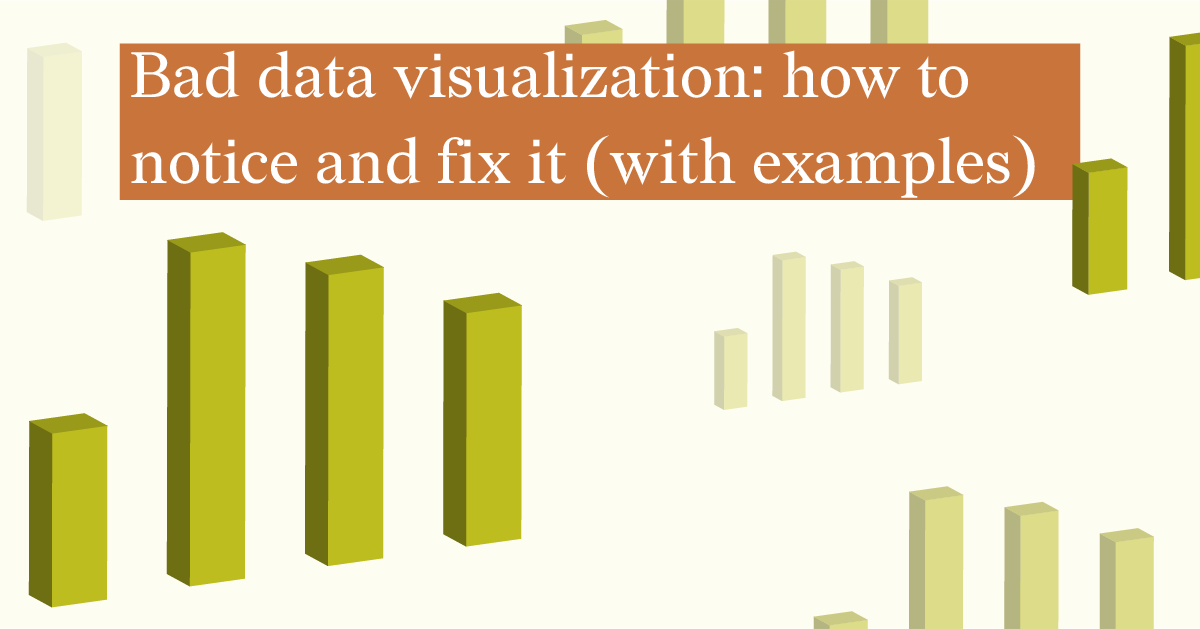
Bad data visualization: how to notice and fix it (27 examples)
Data visualization is a great tool for presenting complex data in a simple way. It is better to...
Subscribe to our newsletter
Receive inspiration, practical advice, customer stories and news right in your mailbox

DataViz Best Practices, Report Design, Food For Thought, Reporting
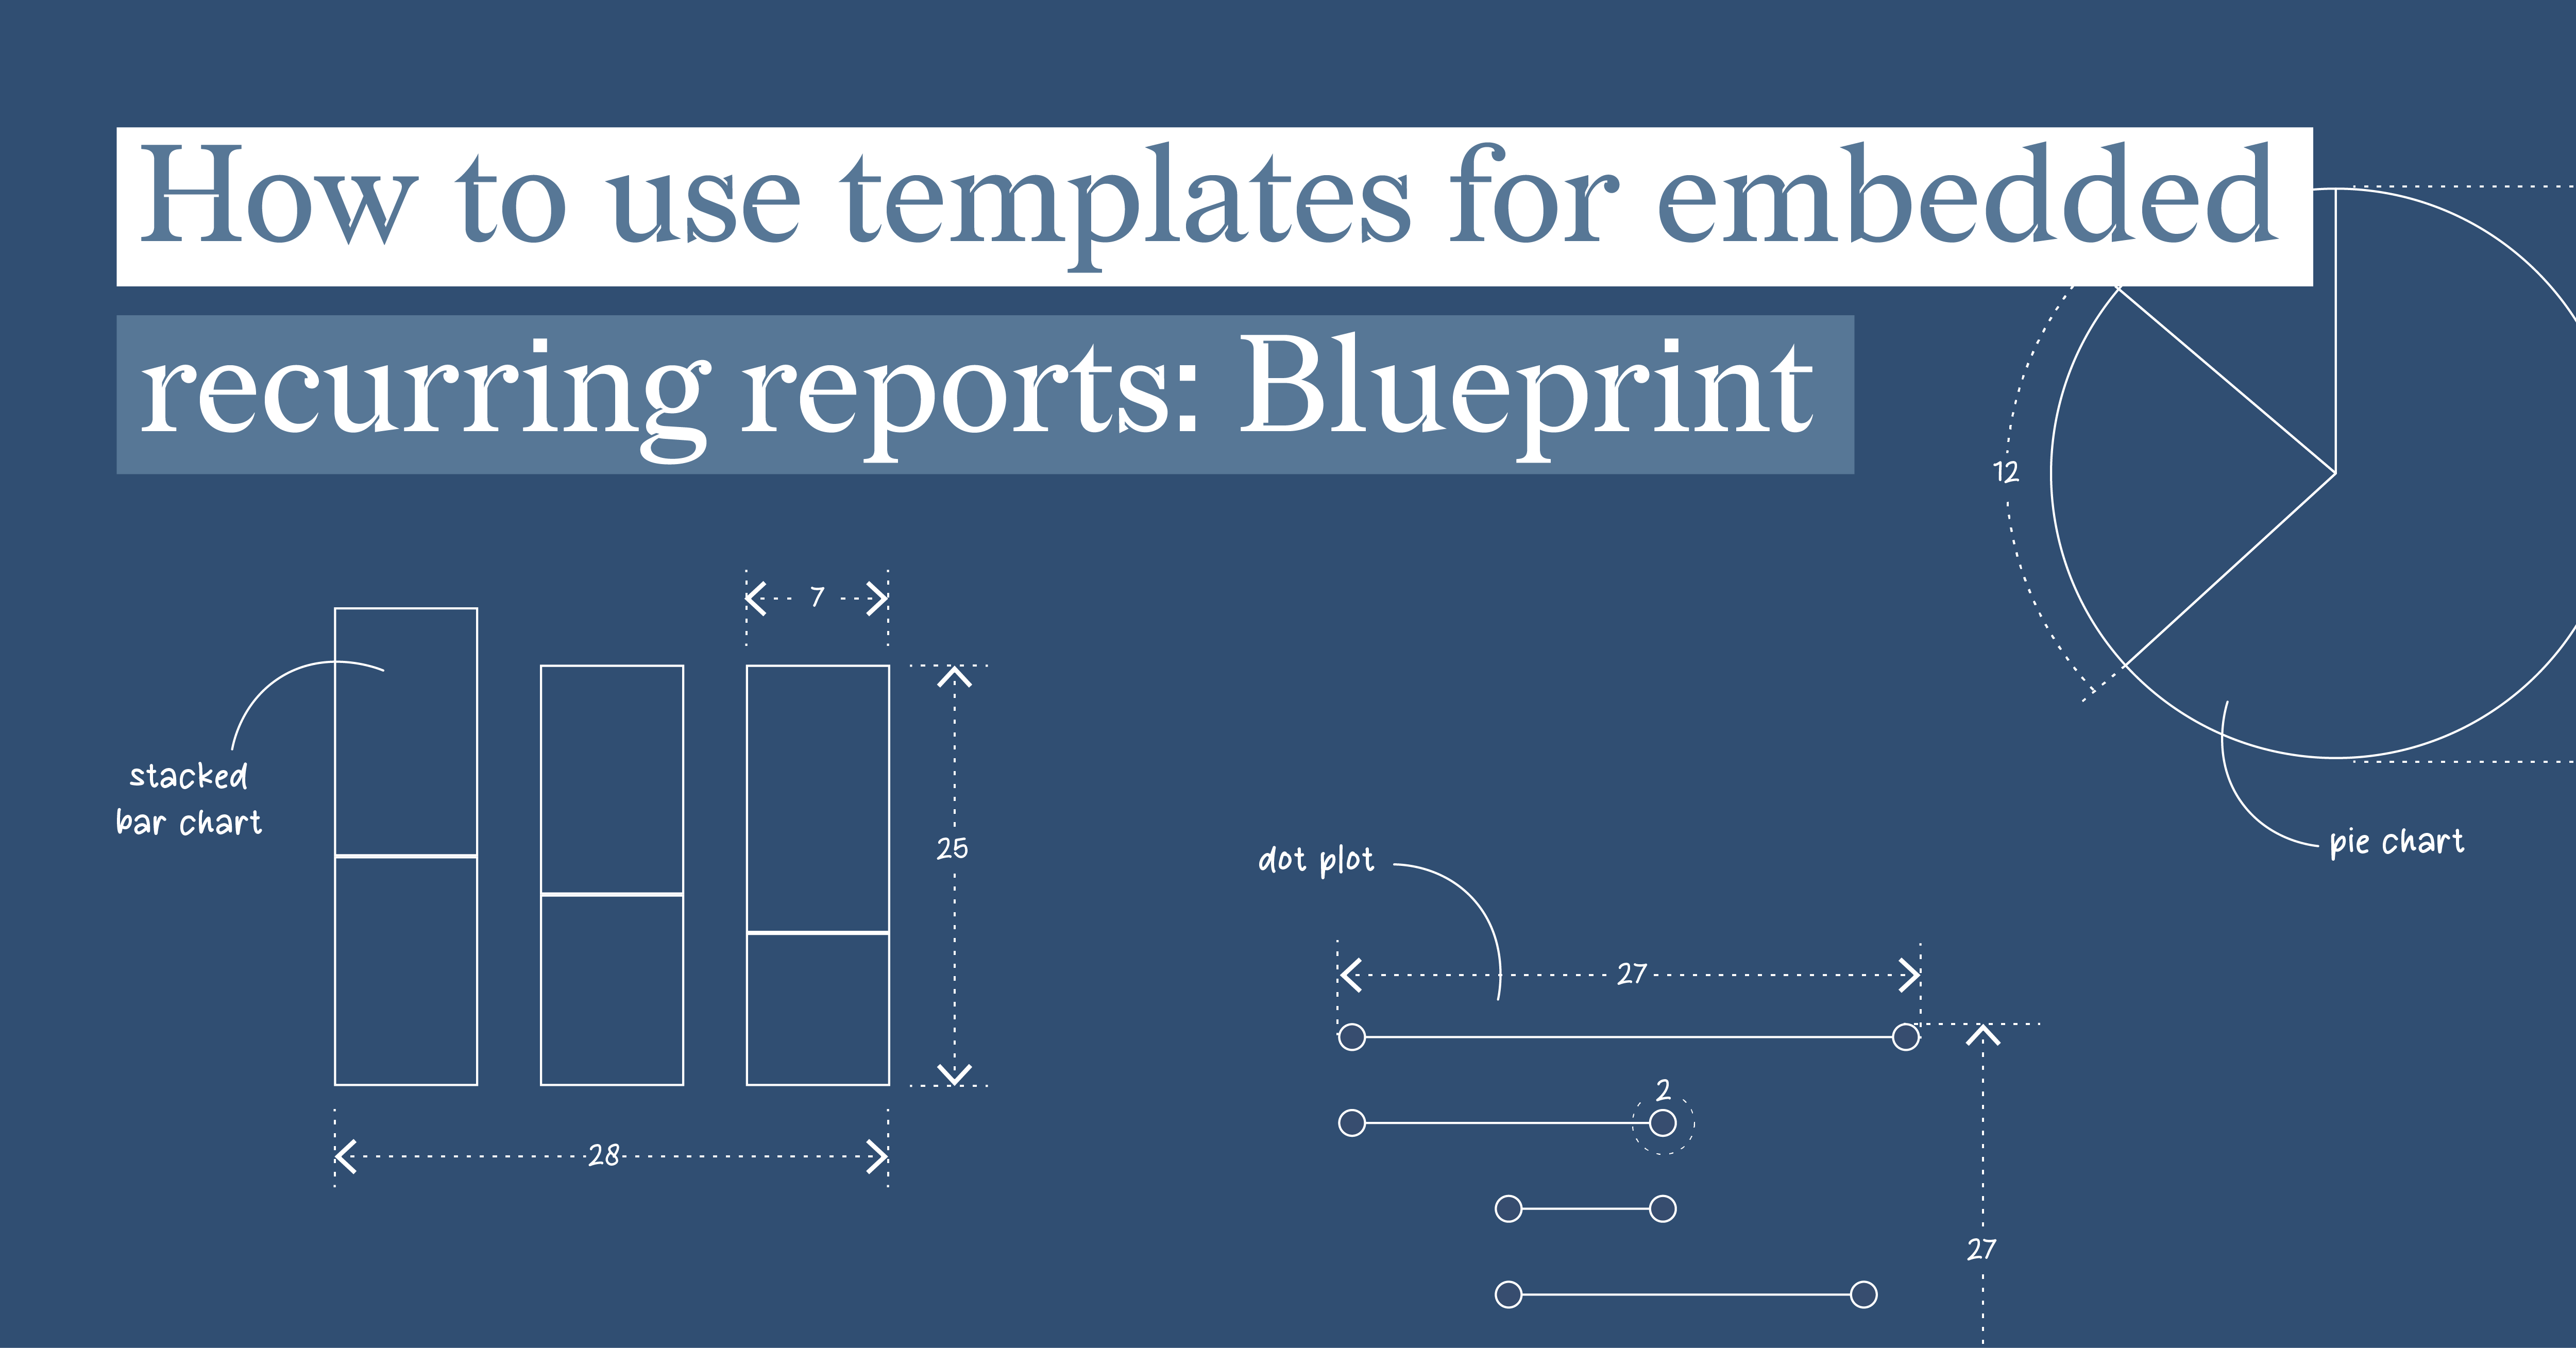
How to use templates for embedded recurring reports: Blueprint
Embedded reports play a crucial role in today's data-driven business landscape. By embedding...
DataViz Best Practices
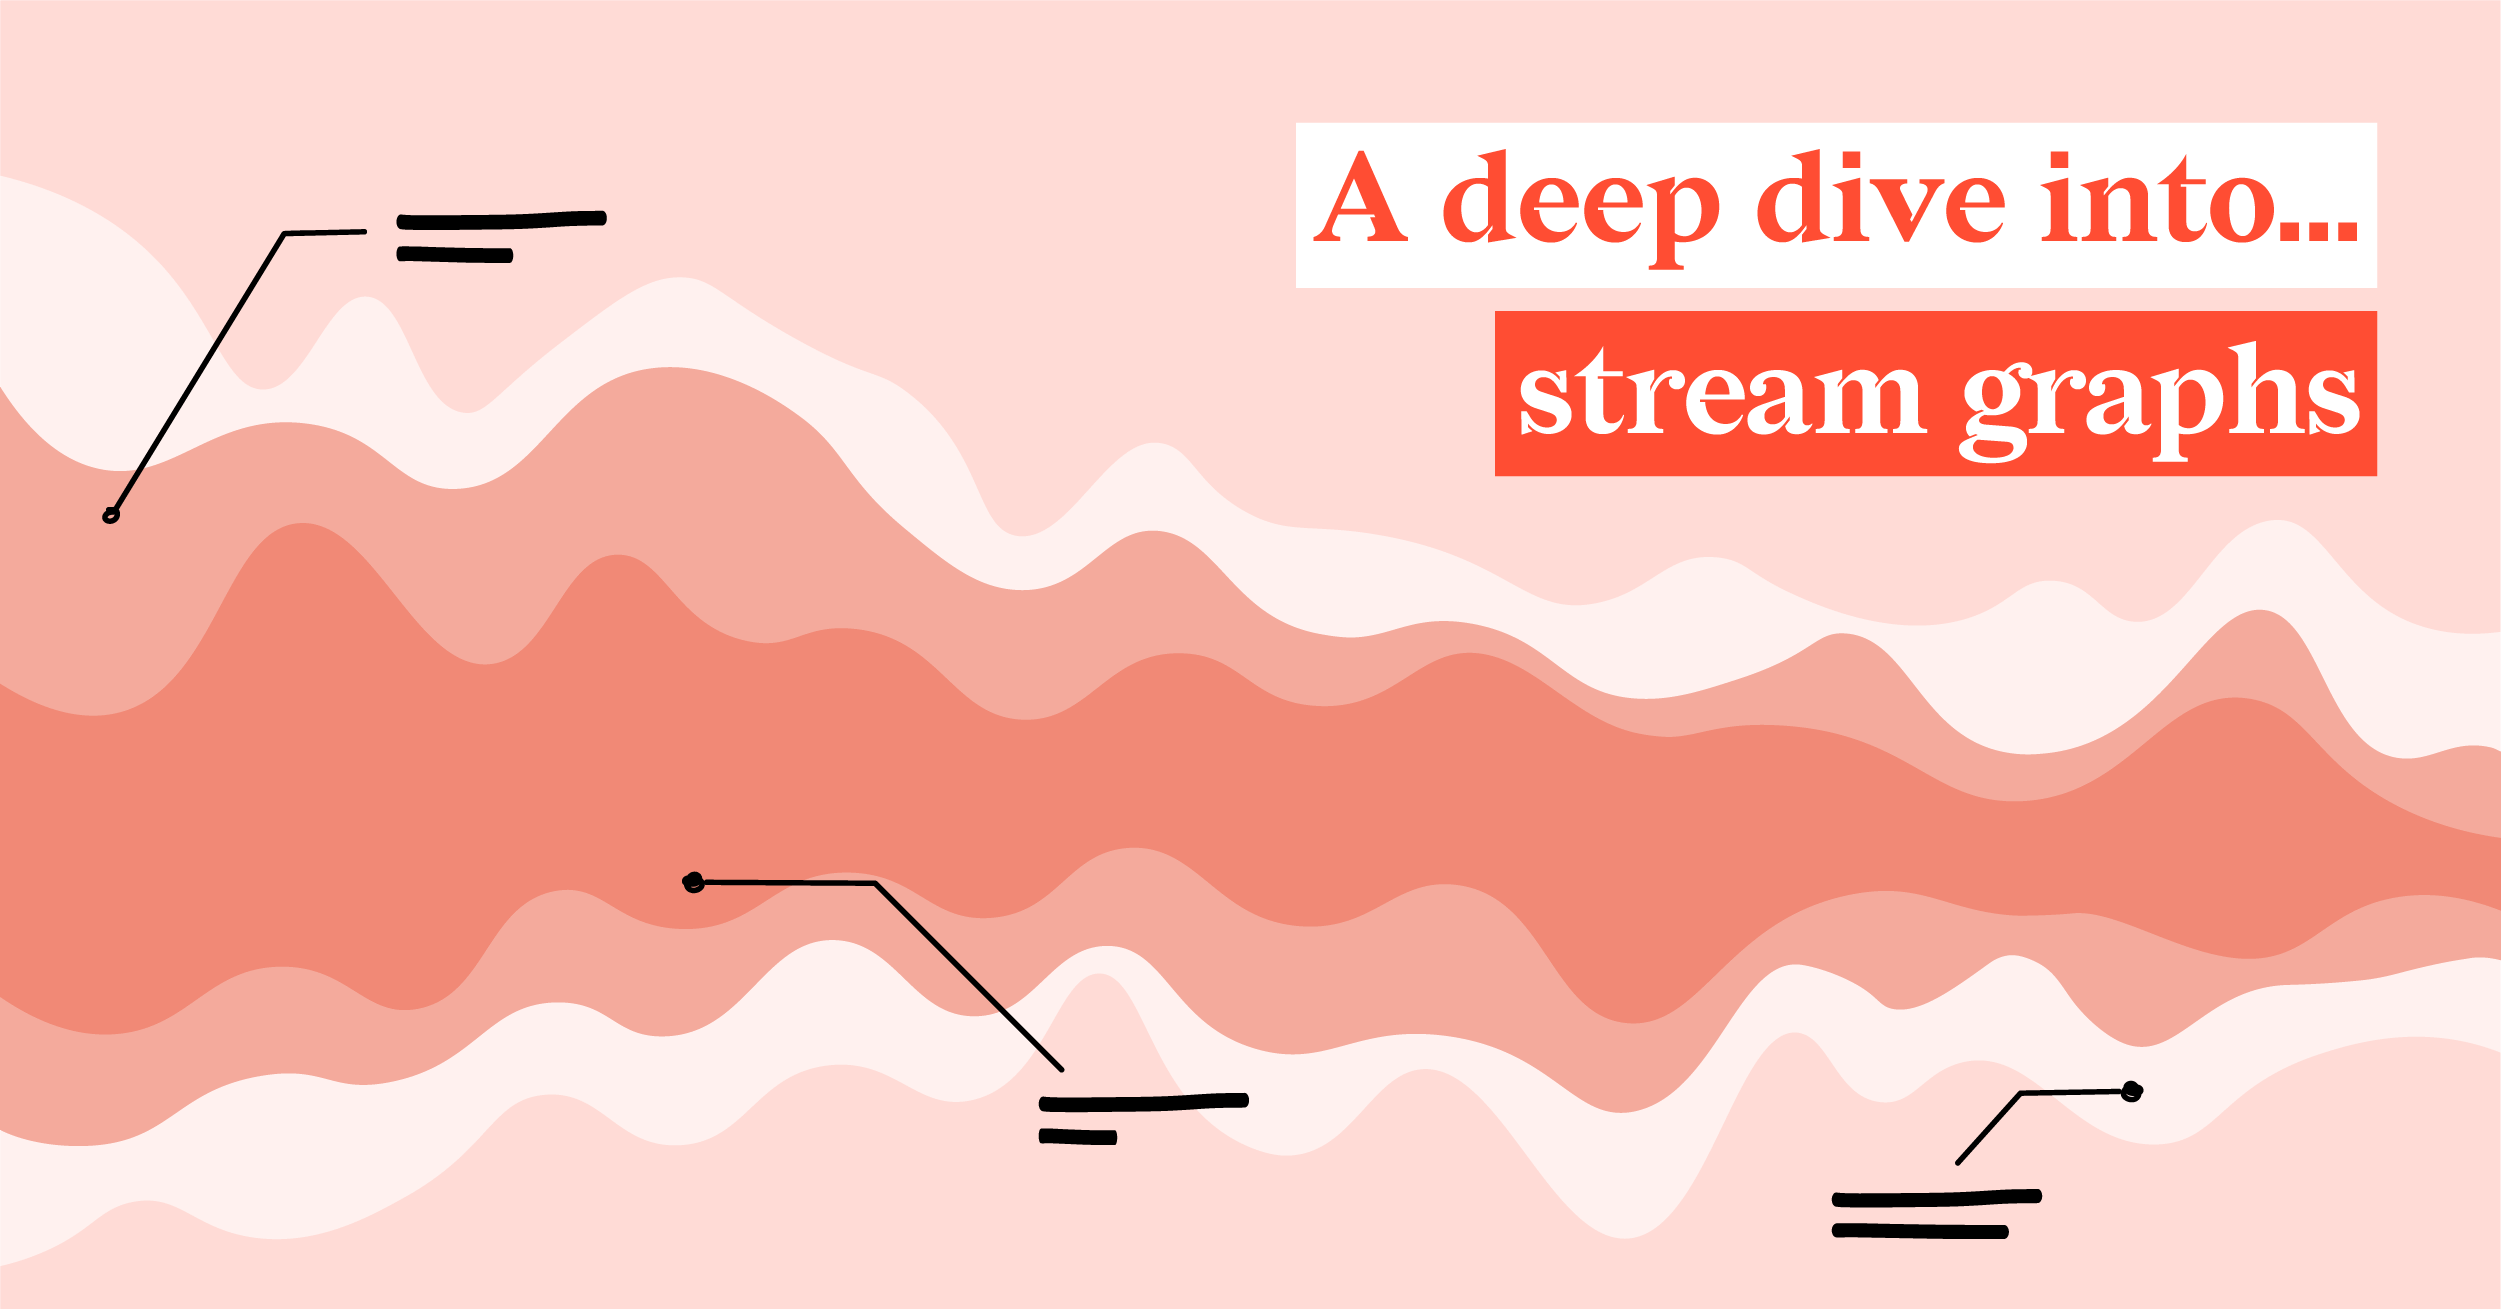
A deep dive into... stream graphs
As a design enthusiast, stream graphs truly speak to my mind. With their elegant and captivating...
DataViz Best Practices
11 tips for designing accessible charts for visually impaired readers
Recently we’ve published an article about how to choose and refine a chart for colorblind viewers....
DataViz Best Practices
5 actionable ways to create engaging and impactful data visualization
The world today is a data-driven economy. Businesses of all sizes rely on data to make informed...
DataViz Best Practices
A deep dive into... scatter plots
When I think about scatter plots, my mind takes me back to the years when I studied and worked as...
DataViz Best Practices
Master the rules - then break them
Rules are everywhere. In modern society, you can not go anywhere without rules to follow. Imagine...
DataViz Best Practices
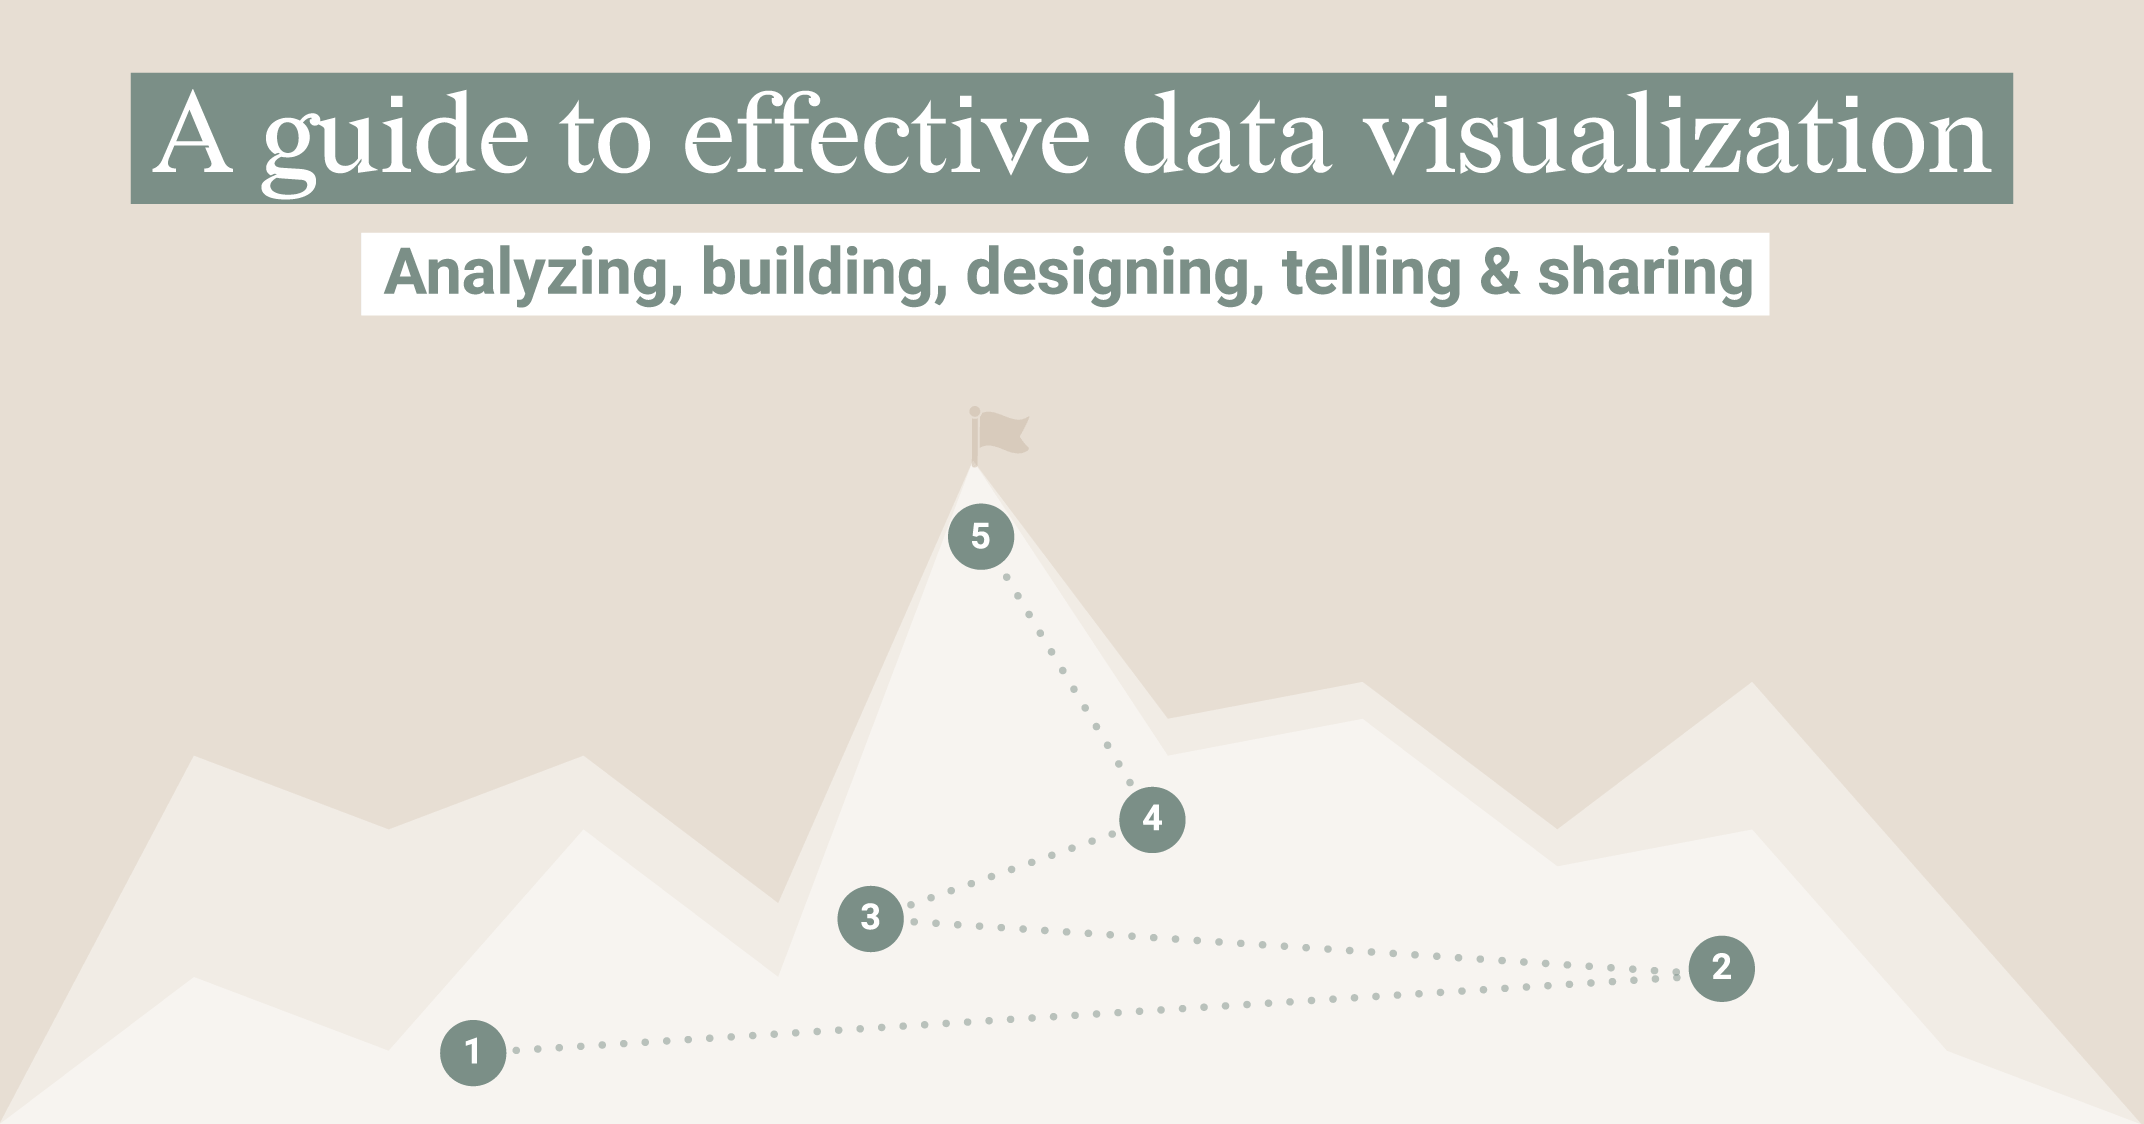
A guide to effective data visualization
The total amount of data in the world is increasing extremely fast. It is forecasted that the...
DataViz Best Practices
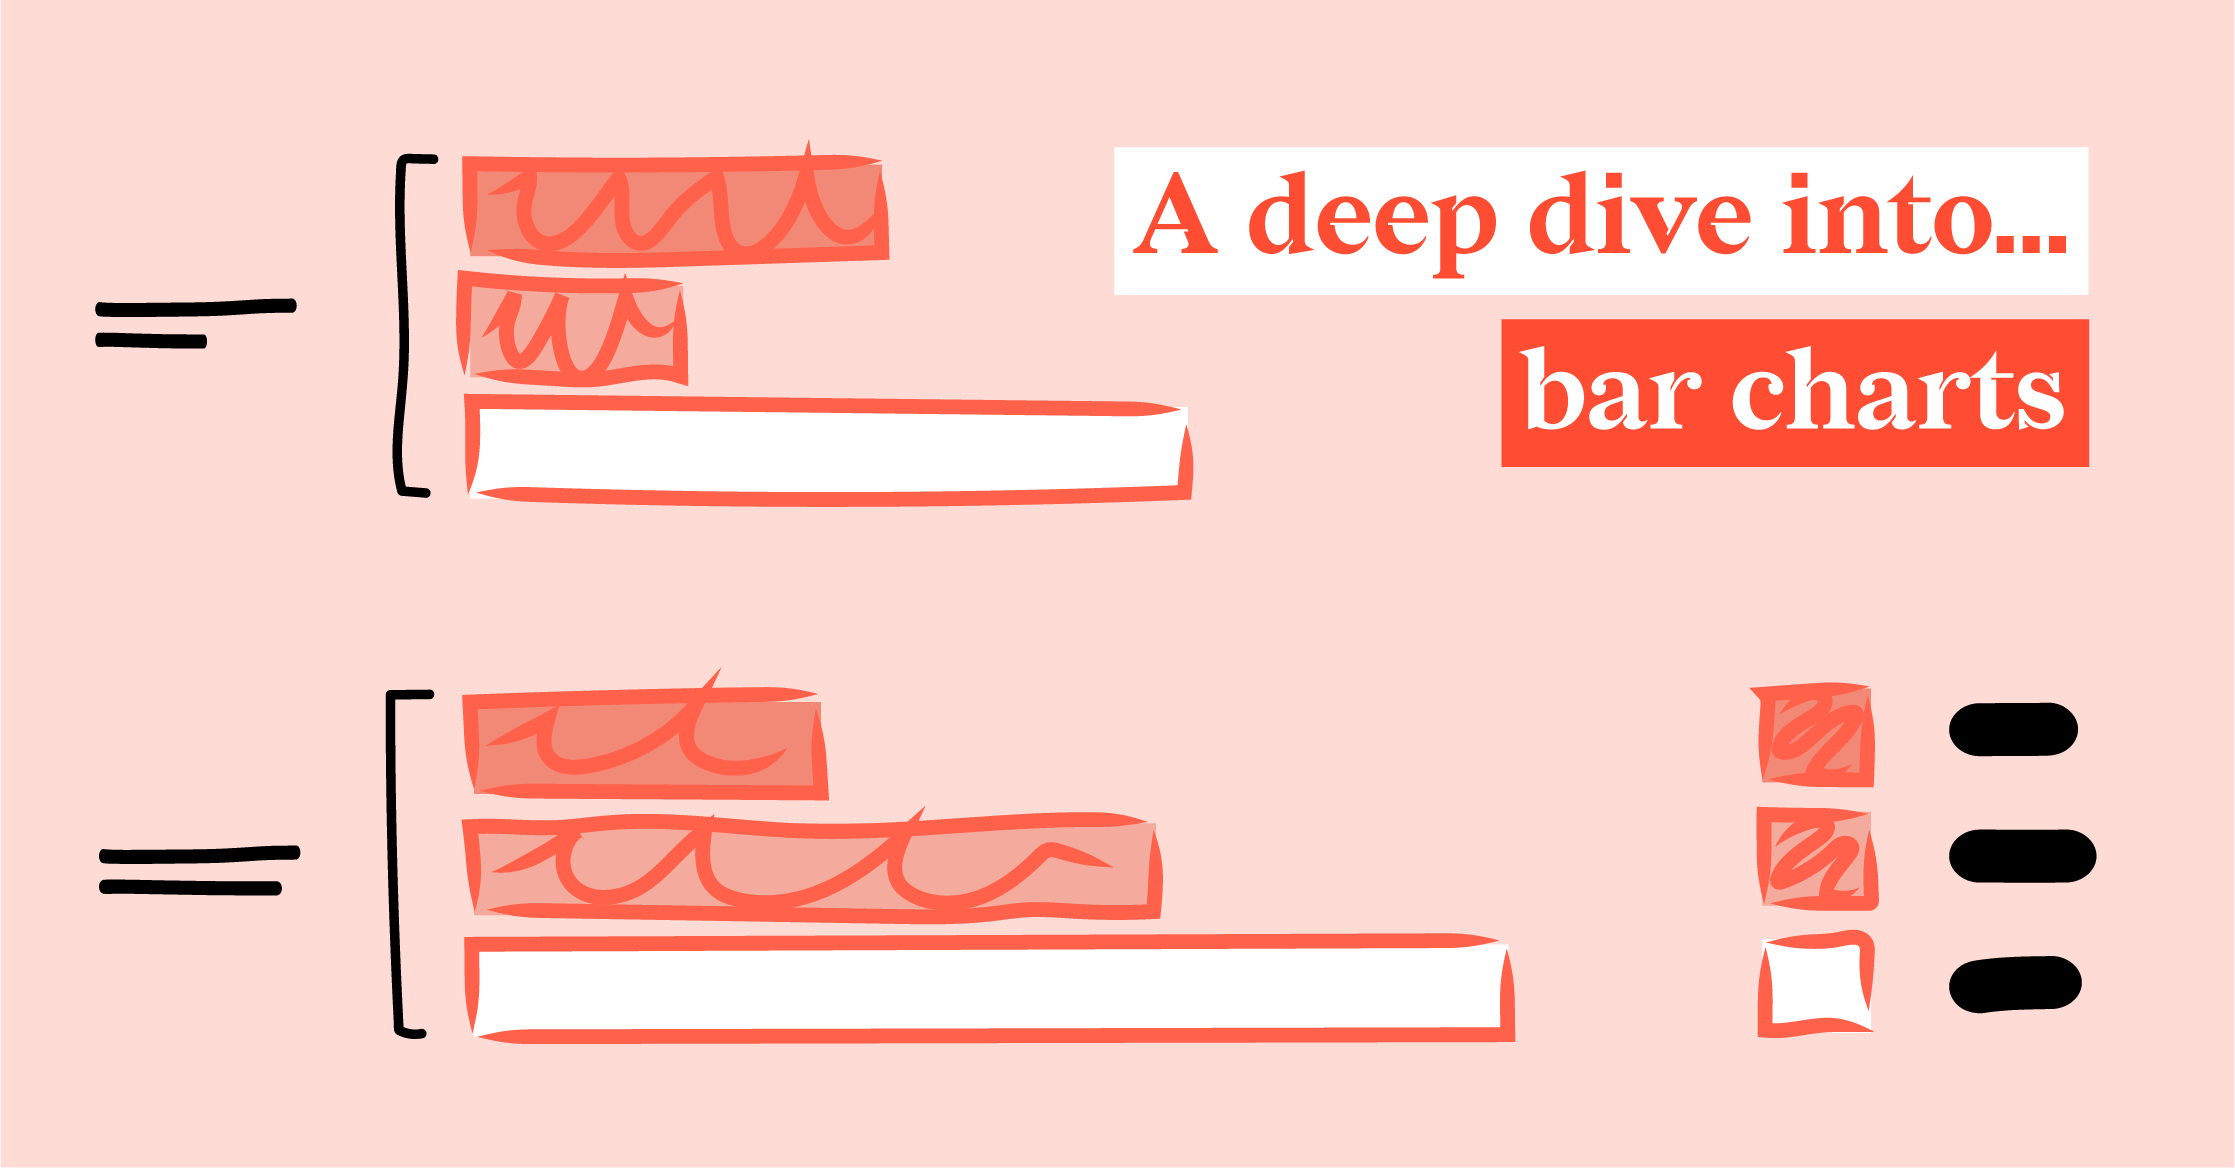
A deep dive into... bar charts
Bar charts and pencils: what do they have in common? When writing this blog, I really don’t know...