Datylon chart chat
When OpenAI released ChatGPT to the public in November 2022, both the potential and challenges of Large Language Model (LLM) applications became evident to the broader audience. The activity in the LLM space has been mind boggling ever since and there are no indications of it slowing down. How this will evolve in the longer run is anyone's guess. While there's undeniably a hype factor at work, it's clear that real value is emerging, value that extends far beyond returning well-structured text. LLMs are here to stay.
Table of contents
|
Large Language Models (LLM) in data visualization
In the data visualization domain, both established players (e.g Highcharts GPT) and newcomers (e.g VizGPT) are exploring ways to harness the capabilities of LLMs. Moreover, ChatGPT's advanced data analysis features, along with a plethora of plugins, help to simplify the visualization of any CSV data.
At Datylon, we took a different approach. Given our product portfolio emphasizes explanatory data analysis, most of our users already know what data they want to visualize in what way and use the Datylon platform to create high fidelity data stories in order to maximize the impact of their data communications.
Datylon Chart Chat development
To get our feet wet, we developed a chat interface that allows users to modify the style properties of a Datylon bar chart. We started out this journey at the time OpenAI released the function calling API.. Where we originally planned to use Langchain Agents, this was an easier alternative. OpenAI announced this feature as: Developers can now describe functions to gpt-4-0613 and gpt-3.5-turbo-0613, and have the model intelligently choose to output a JSON object containing arguments to call those functions. This is a new way to more reliably connect GPT's capabilities with external tools and APIs.
We first designed and implemented a minimal API to manage bar chart related style properties. More specifically, this API allows changing bar colors, data labels, axes tick and axes grid settings.
Next we delved into describing the functions and the function parameters (“prompt engineering”). Providing a description of the API and its parameters, such that given the users’ chat input, OpenAI generates the correct API parameters, ended up being the biggest challenge. Small changes in the parameter description or user chat input can easily result in unexpected output of the OpenAI service. We tried to add regular expression descriptions for the parameters as supported by the OpenAI API, but that did not seem to make a difference.
As an example, below you find a small part of the code used to build the function description input
|
const change_color_parameter_bars = ` To identify bars use an array of strings. Use the following structure for the strings 1. ordinal:.... when the bars are identified by ordinals. Supported: numbers, positions relative to first and last. E.g 'first, bar 2 and three last bars' would become 'ordinal:first,2,last-2,last-1,last'. 'all' would become 'ordinal:all'.
3. color:... when the bars are identified by color. E.g. 'all green bars' become 'color:rgba(0,255,0,1)'. 4. category:... when the bar category is specified, E.g. 'the bar for sales' become 'category:sales'`; const change_color_parameter_bars_ordinal_regex = 'ordinal:(all|\\d+|first(\\+\\d+)?|last(\\-\\d+)?)(,(all|\\d+|first(\\+\\d+)?|last(\\[+|-]\\d+)?))*'; const change_color_parameter_bars_color_regex = 'color:rgba\([0-9]+,[0-9]+,[0-9]+,[0-9]+\)'; const change_color_parameter_bars_category_regex = 'category:.+'; const change_color_parameter_bars_value_regex = 'value:(largest|smallest|(=|<|>)?[+-]?((\\d+\.?\\d*)|(\.\\d+)))?$'; const color_color_parameters_bars_regex =`${change_color_parameter_bars_ordinal_regex}|$ {change_color_parameter_bars_color_regex}|$ {change_color_parameter_bars_category_regex}|$ {change_color_parameter_bars_value_regex}`; |
Examples
And here are some examples of bar charts, user messages and the effect on the chart.
Example 1: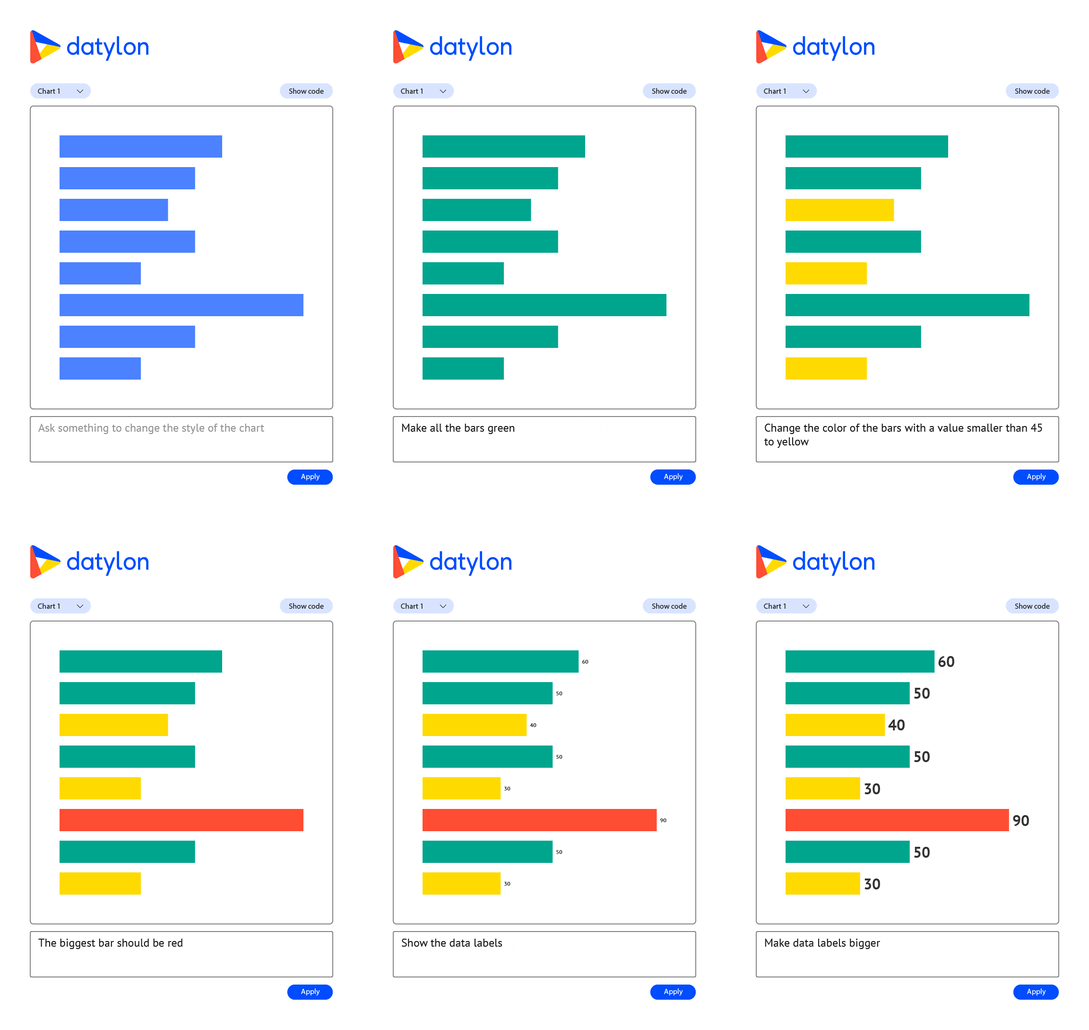
User requests in order
- make all the bars green
- change the color of the bars with a value smaller than 45 to yellow
- The biggest bar should be pink
- Show the data labels
- make the data labels bigger
Example 2: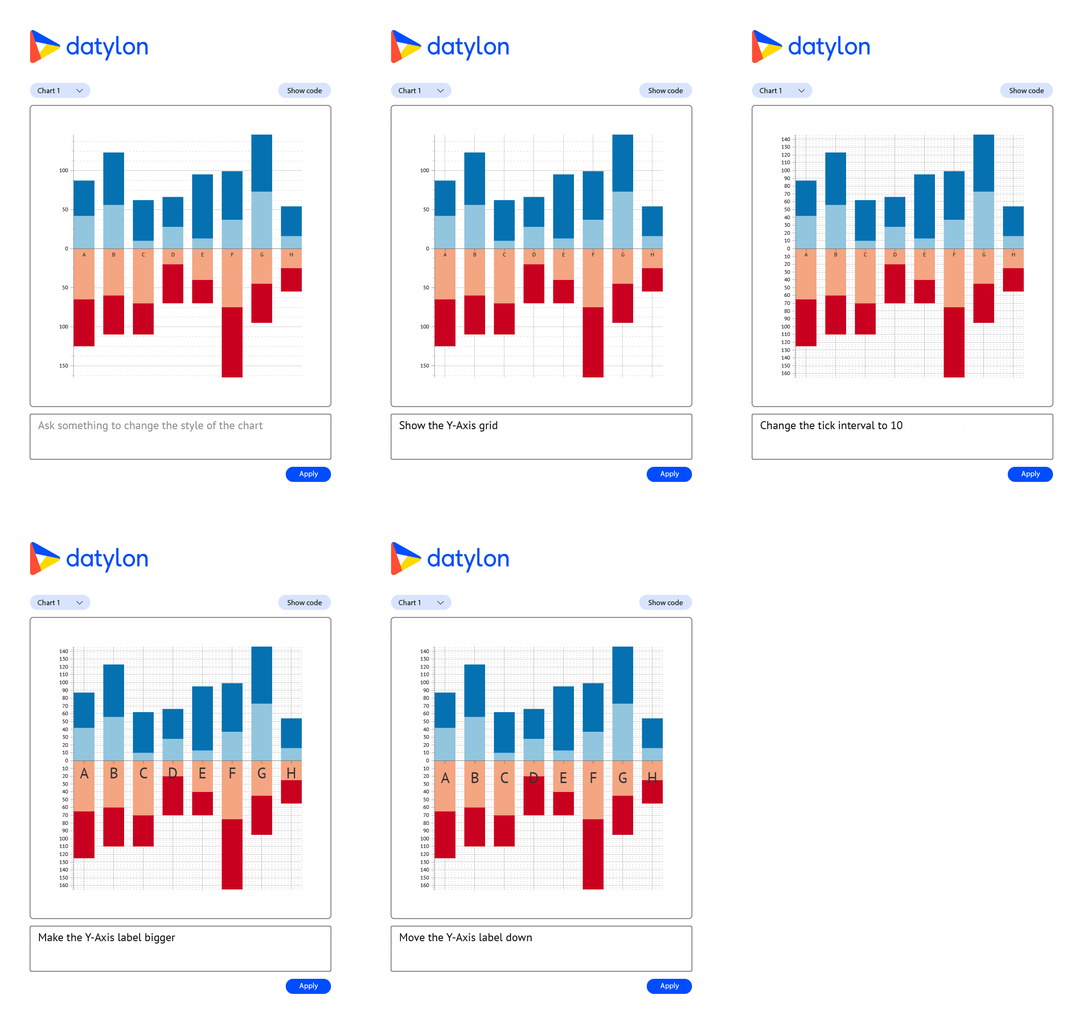
User requests in order
- show the y-axis grid
- hide the x-axis grid
- change the x-axis tick interval to 10
- make the y-axis labels bigger
- move the y-axis labels down
Lessons learned
- Datylon charts are very customizable. This requires a large amount of style properties. While it’s not difficult to implement this in an API, it’s not trivial to provide sufficiently detailed prompts, such that OpenAI generates the correct function call on the users’ chat input.
- For the same reason the user needs to describe the expected change in great detail and the risk such description can be interpreted in different ways is real.
- The generated function call arguments are not always correct.
- Switching OpenAI LLM models (from gpt-3.5-turbo-0613 to gpt-4-1106-preview) required rework of some of the prompts.
Possible follow up steps
- Instead of trying to expose each individual style property through a chat api, it seems more realistic to build a chat interface where the user can manipulate some common properties over multiple charts, e.g.
- Apply a color palette over all (bar) charts in a Datylon design
- Change the font (color) of all data labels of all line charts
- etc.
- Experiment with technologies that provide better control over the LLM output to avoid ‘hallucinations’. E.g. LMQL (A Query Language for Large Language Models), Guidance, etc.
- Explore the possibilities of AutoGen or OpenAI's newly introduced 'Assistants API, Retrieval, and Code Interpreter' features. These tools can be utilized to design multi-step interactions which could simplify the process for users to provide detailed requests through a conversational exchange between the service and the user.
Conclusion
The general availability of LLMs and LLM related services is impacting a large part of the software industry. The possibility to interact with applications using natural language promises to lower the learning curve for a lot of systems. At the same time complex systems come with lot’s of options. It is unclear how efficient natural language interfaces will turn out to be in such cases. Our experiments to use Open AI function calling to update style properties of a Datylon bar chart, demonstrated these promises but also revealed some of the difficulties. The LLM domain is evolving rapidly and multistep interactions (through e.g. agents) are expected to solve at least some of these issues.
While we haven't yet implemented a chart chat feature at Datylon, we're actively exploring its potential. However, our platform already offers robust tools for making data visualizations more efficient and accessible. Our Datylon Report Server provides a powerful solution for automated reporting, allowing you to design templates once and then generate multiple charts and reports automatically, using the latest data. This means you can create reports on-demand or schedule them for regular delivery, streamlining your workflow and ensuring your insights are always up-to-date.
Ready to see Datylon in action? Book a demo today with one of our data visualization specialists and discover how our tools can optimize your workflow and transform your data into actionable insights.
Acknowledgement
The contribution of Stijn Coppens who developed most of the code during his summer internship is greatly appreciated.

Peter Coppens - Founder & CTO
Peter has a strong passion to create software technology to solve customer problems in a pragmatic way. Being an experienced software engineer, he’s generous with his knowledge while constantly being eager to learn new approaches himself.

