


DataViz Best Practices, Dataviz Resources, Chart Design, Chart Types
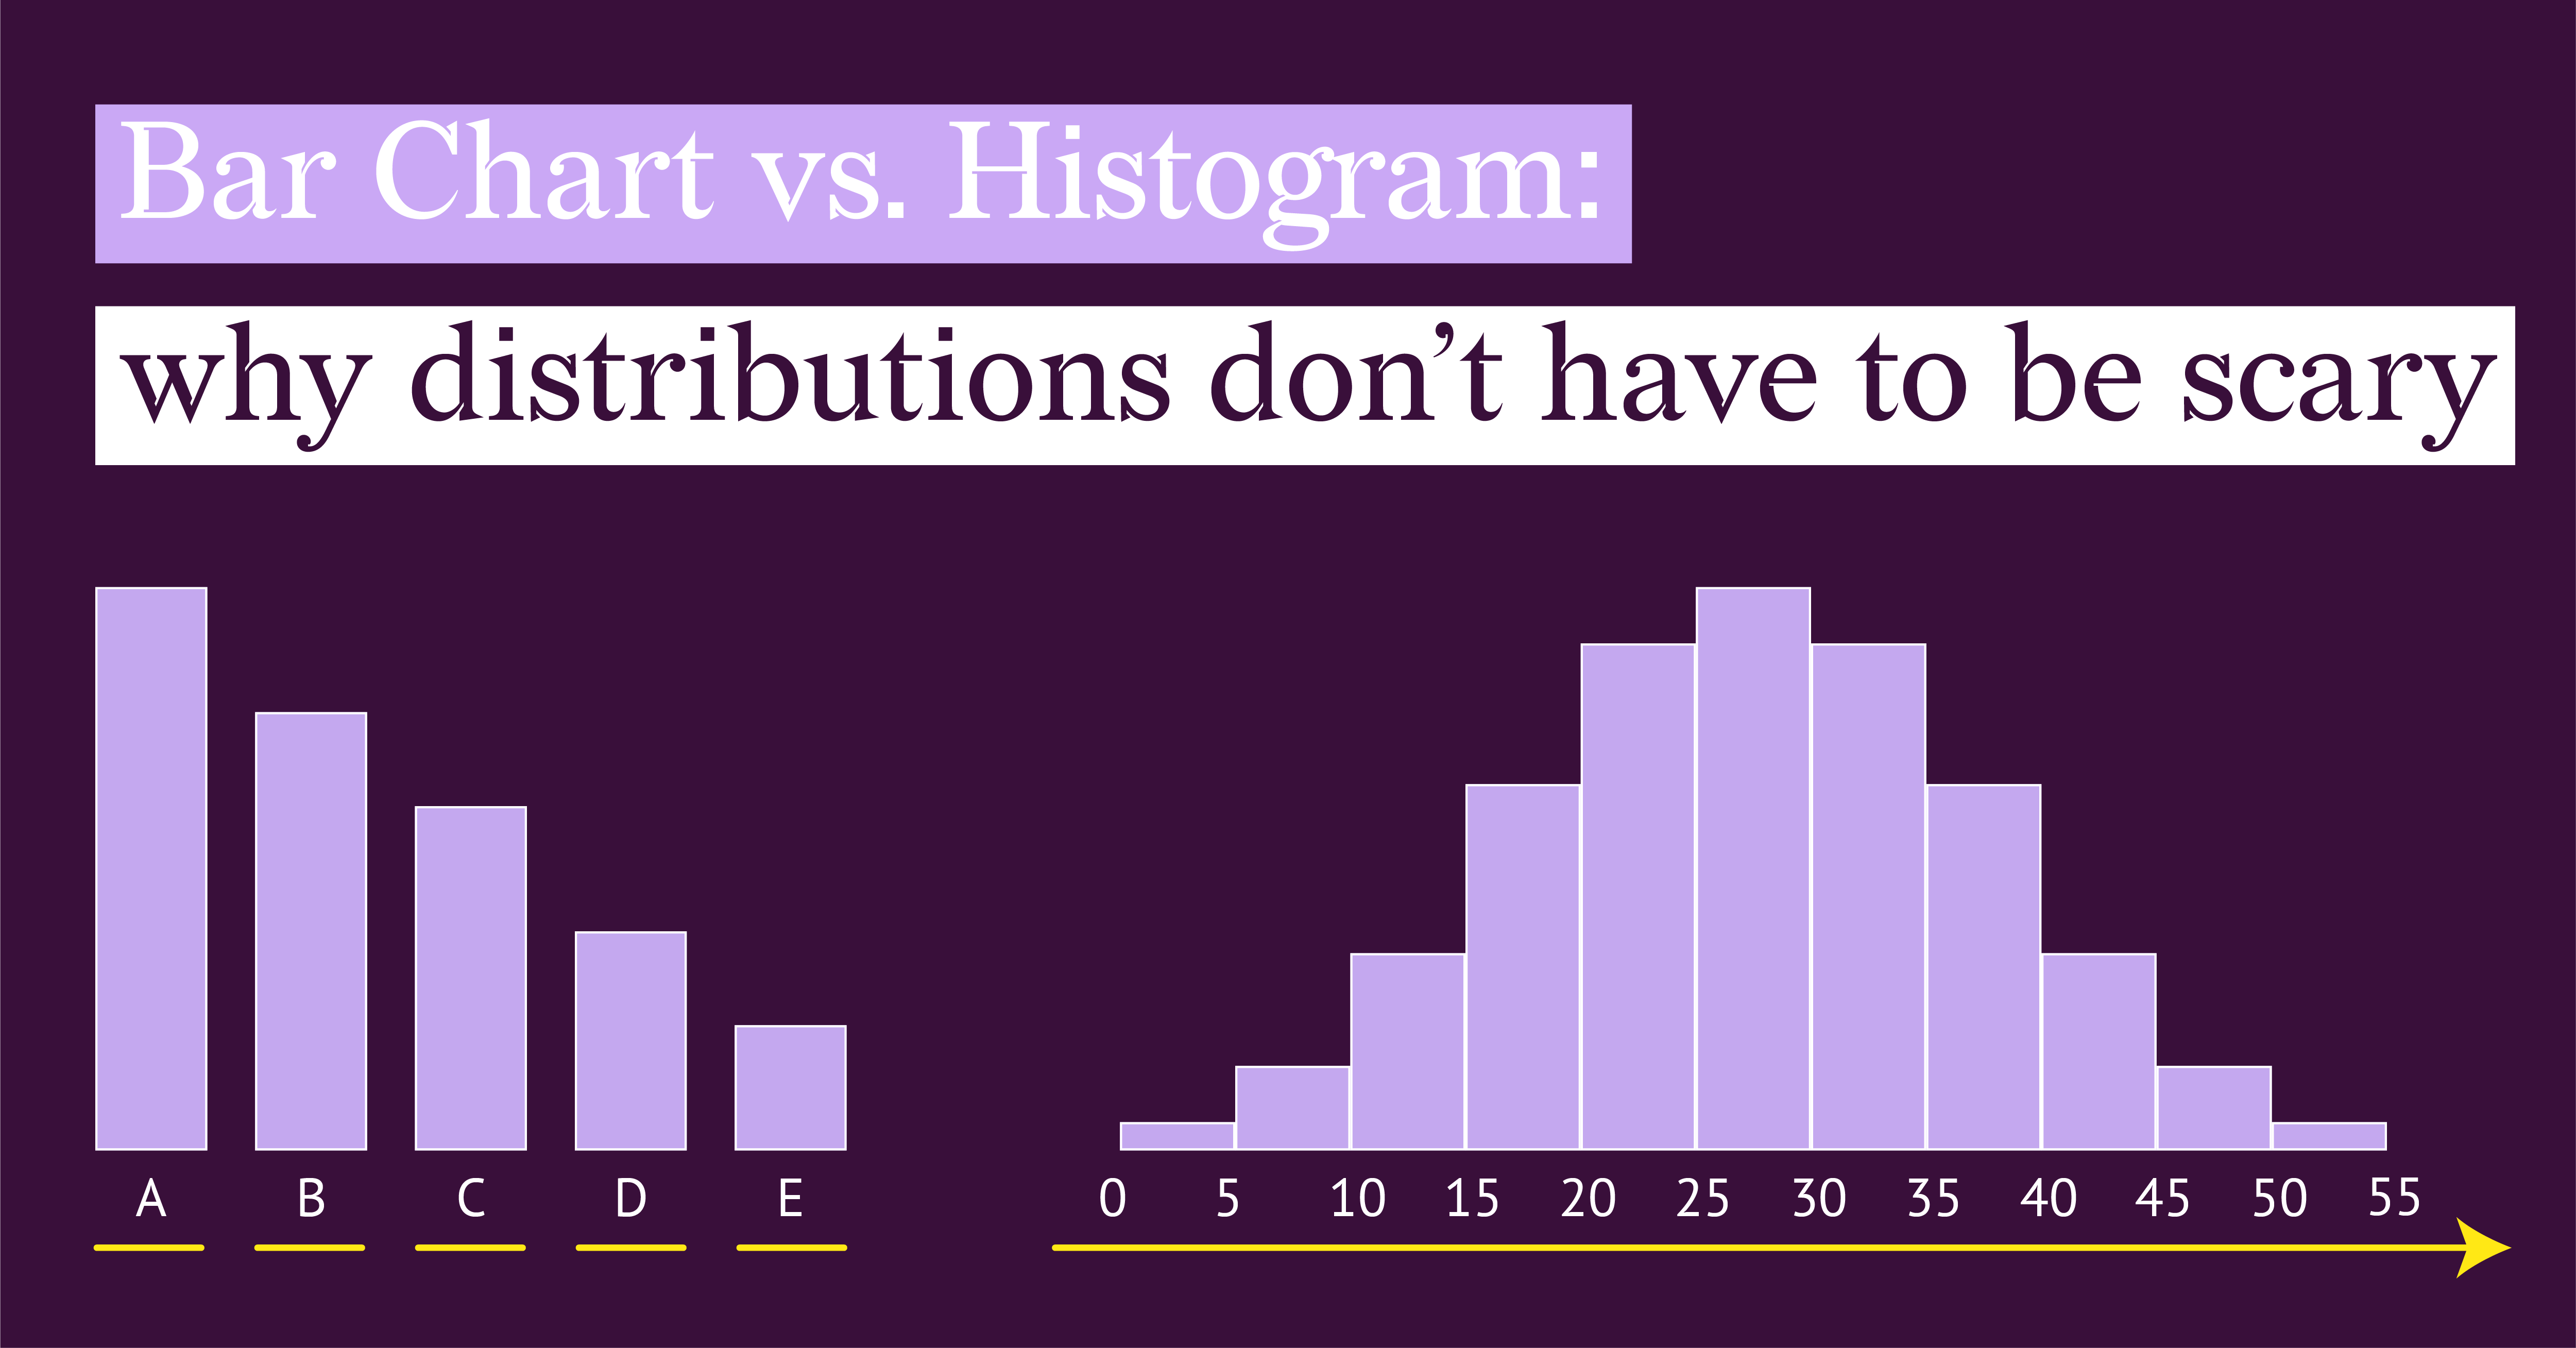
Bar Chart vs. Histogram: Why Distributions Don't Have to Be Scary
Histograms and bar charts look almost identical. If you have ever stared at your data trying to...
Dataviz Resources
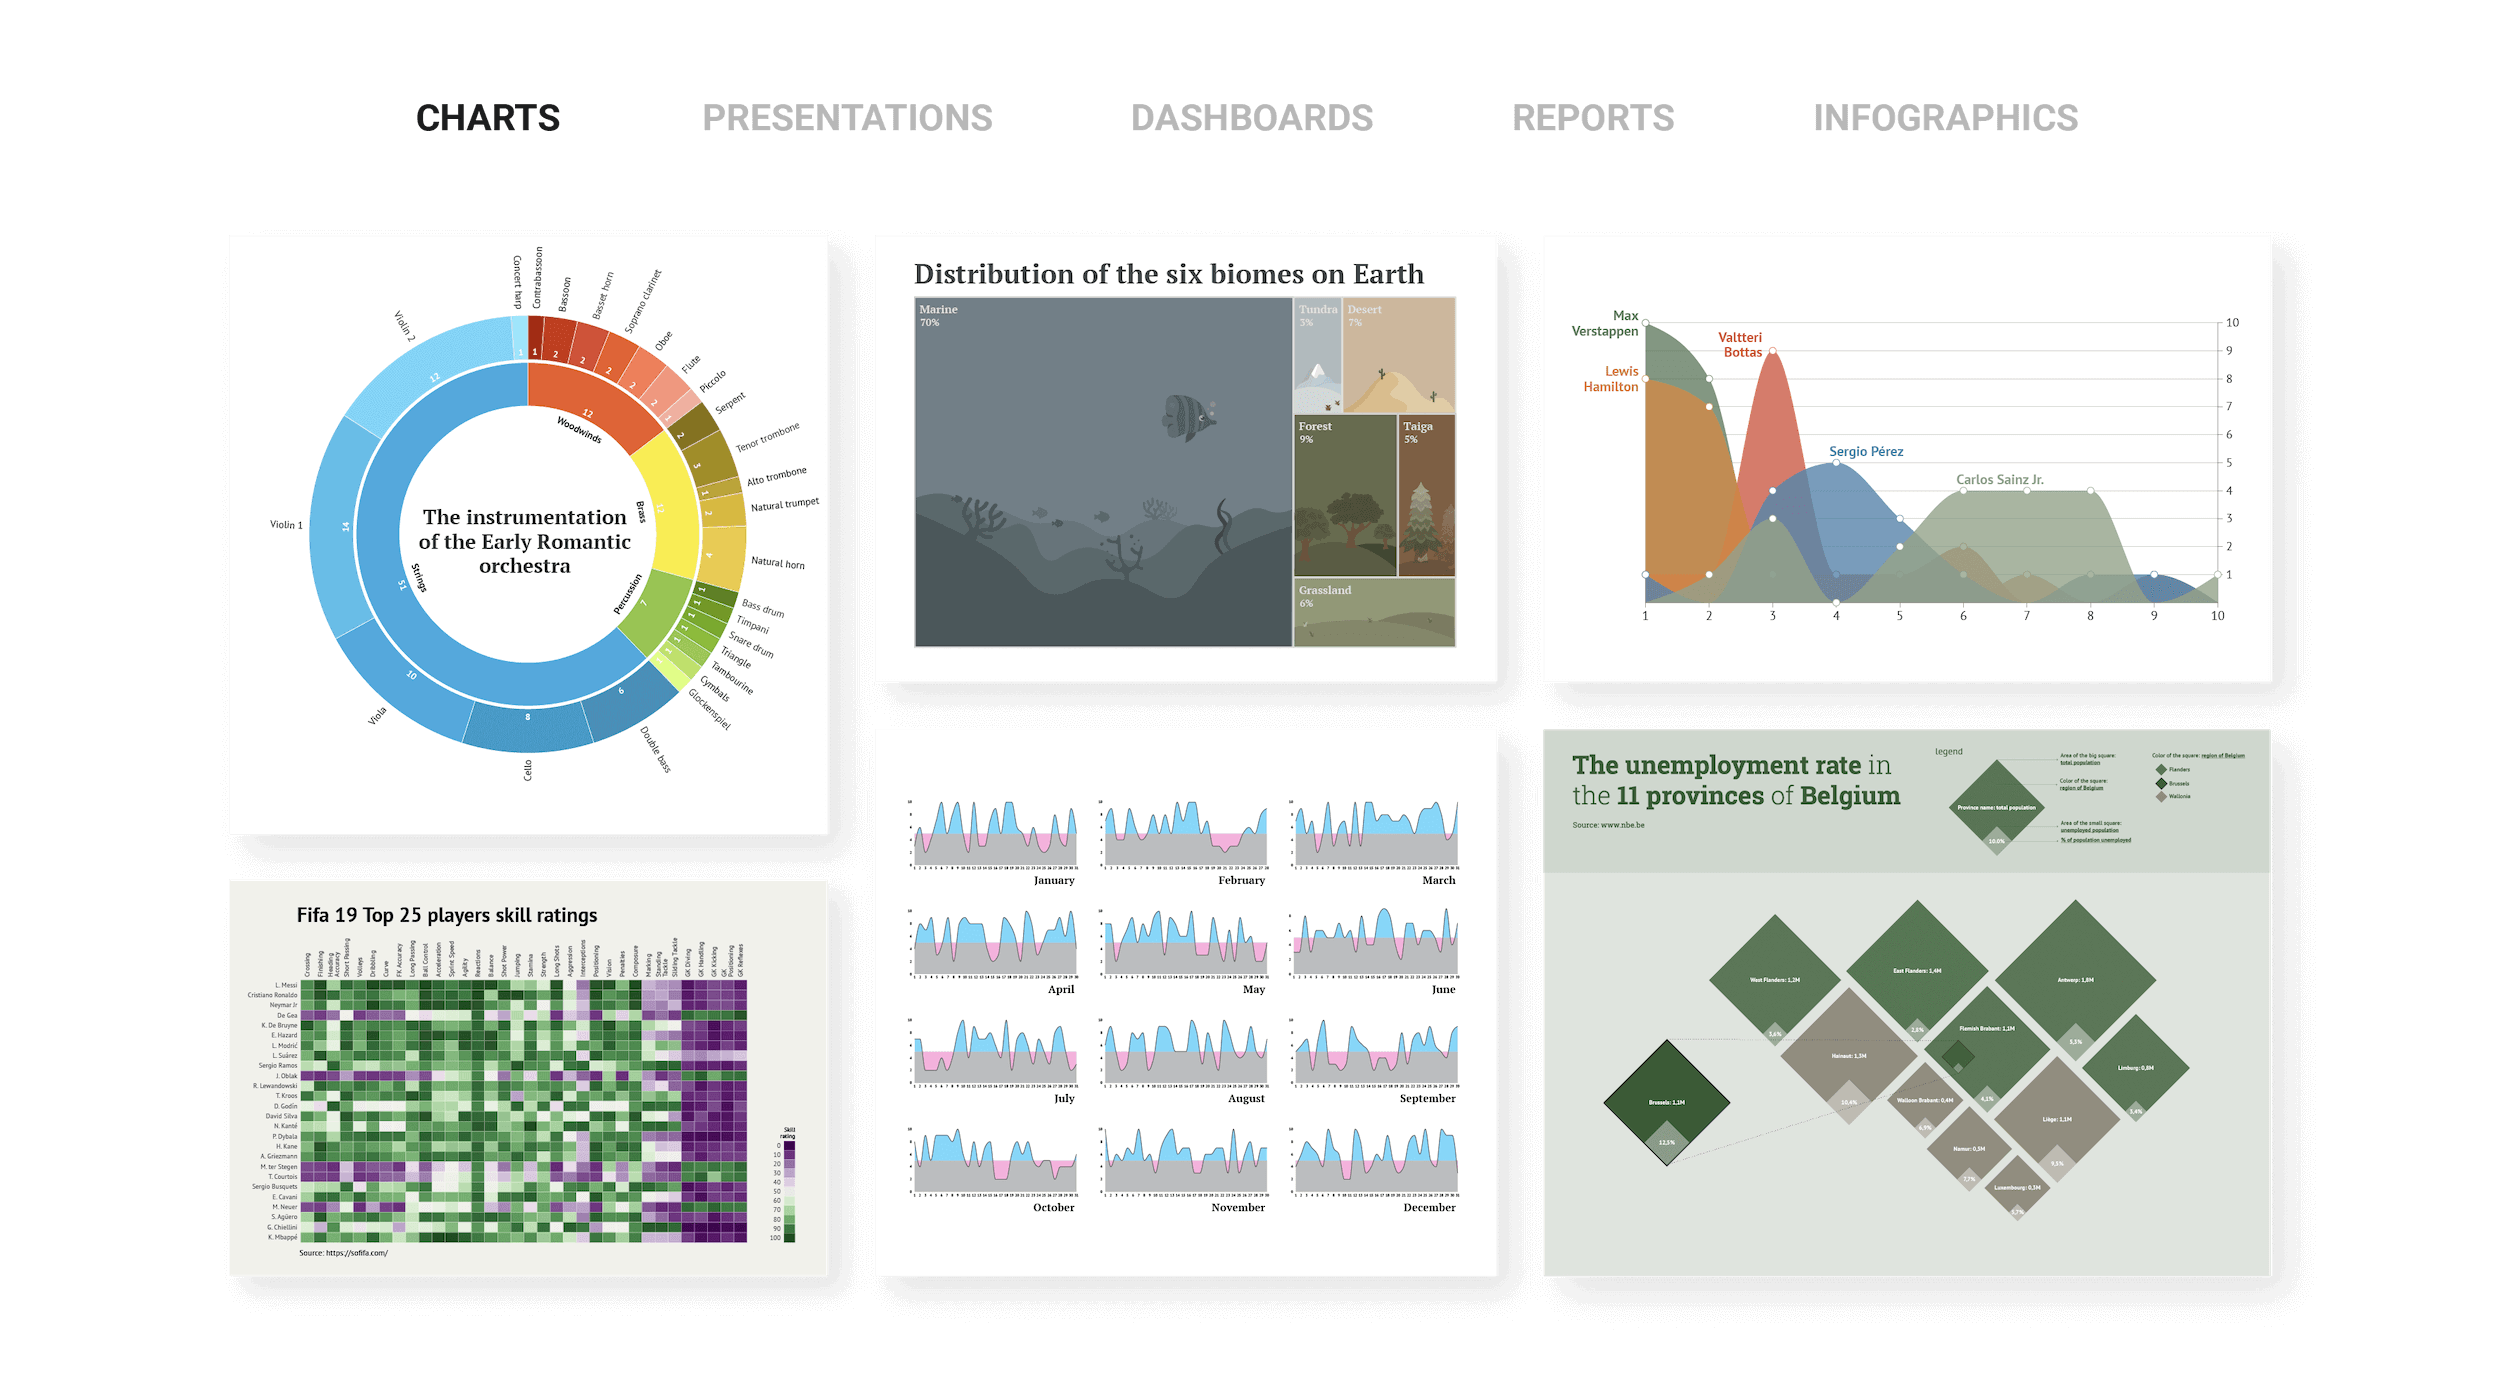
Top 10 data visualizations of all time
You know that spark when a chart tells you more than words ever could? I’ve gathered ten standout...
Report Design, Food For Thought, ESG Reporting
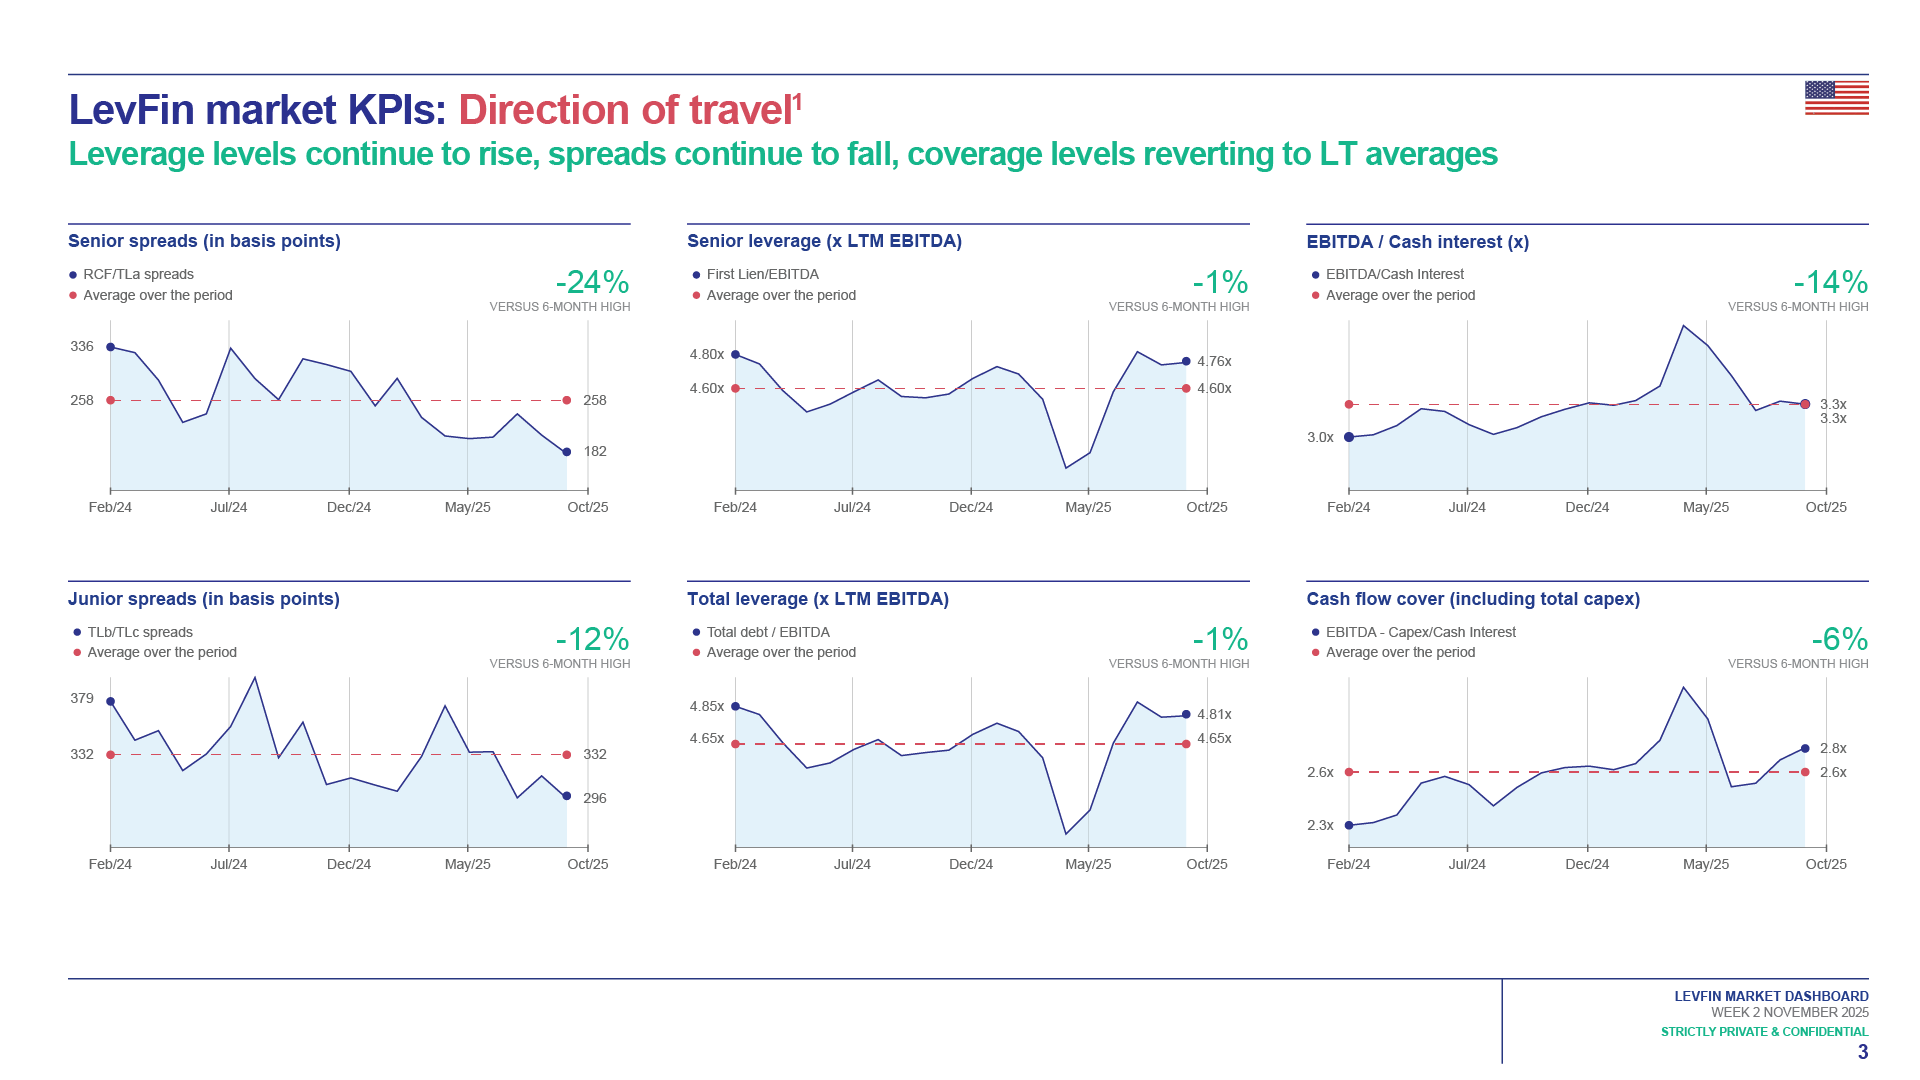
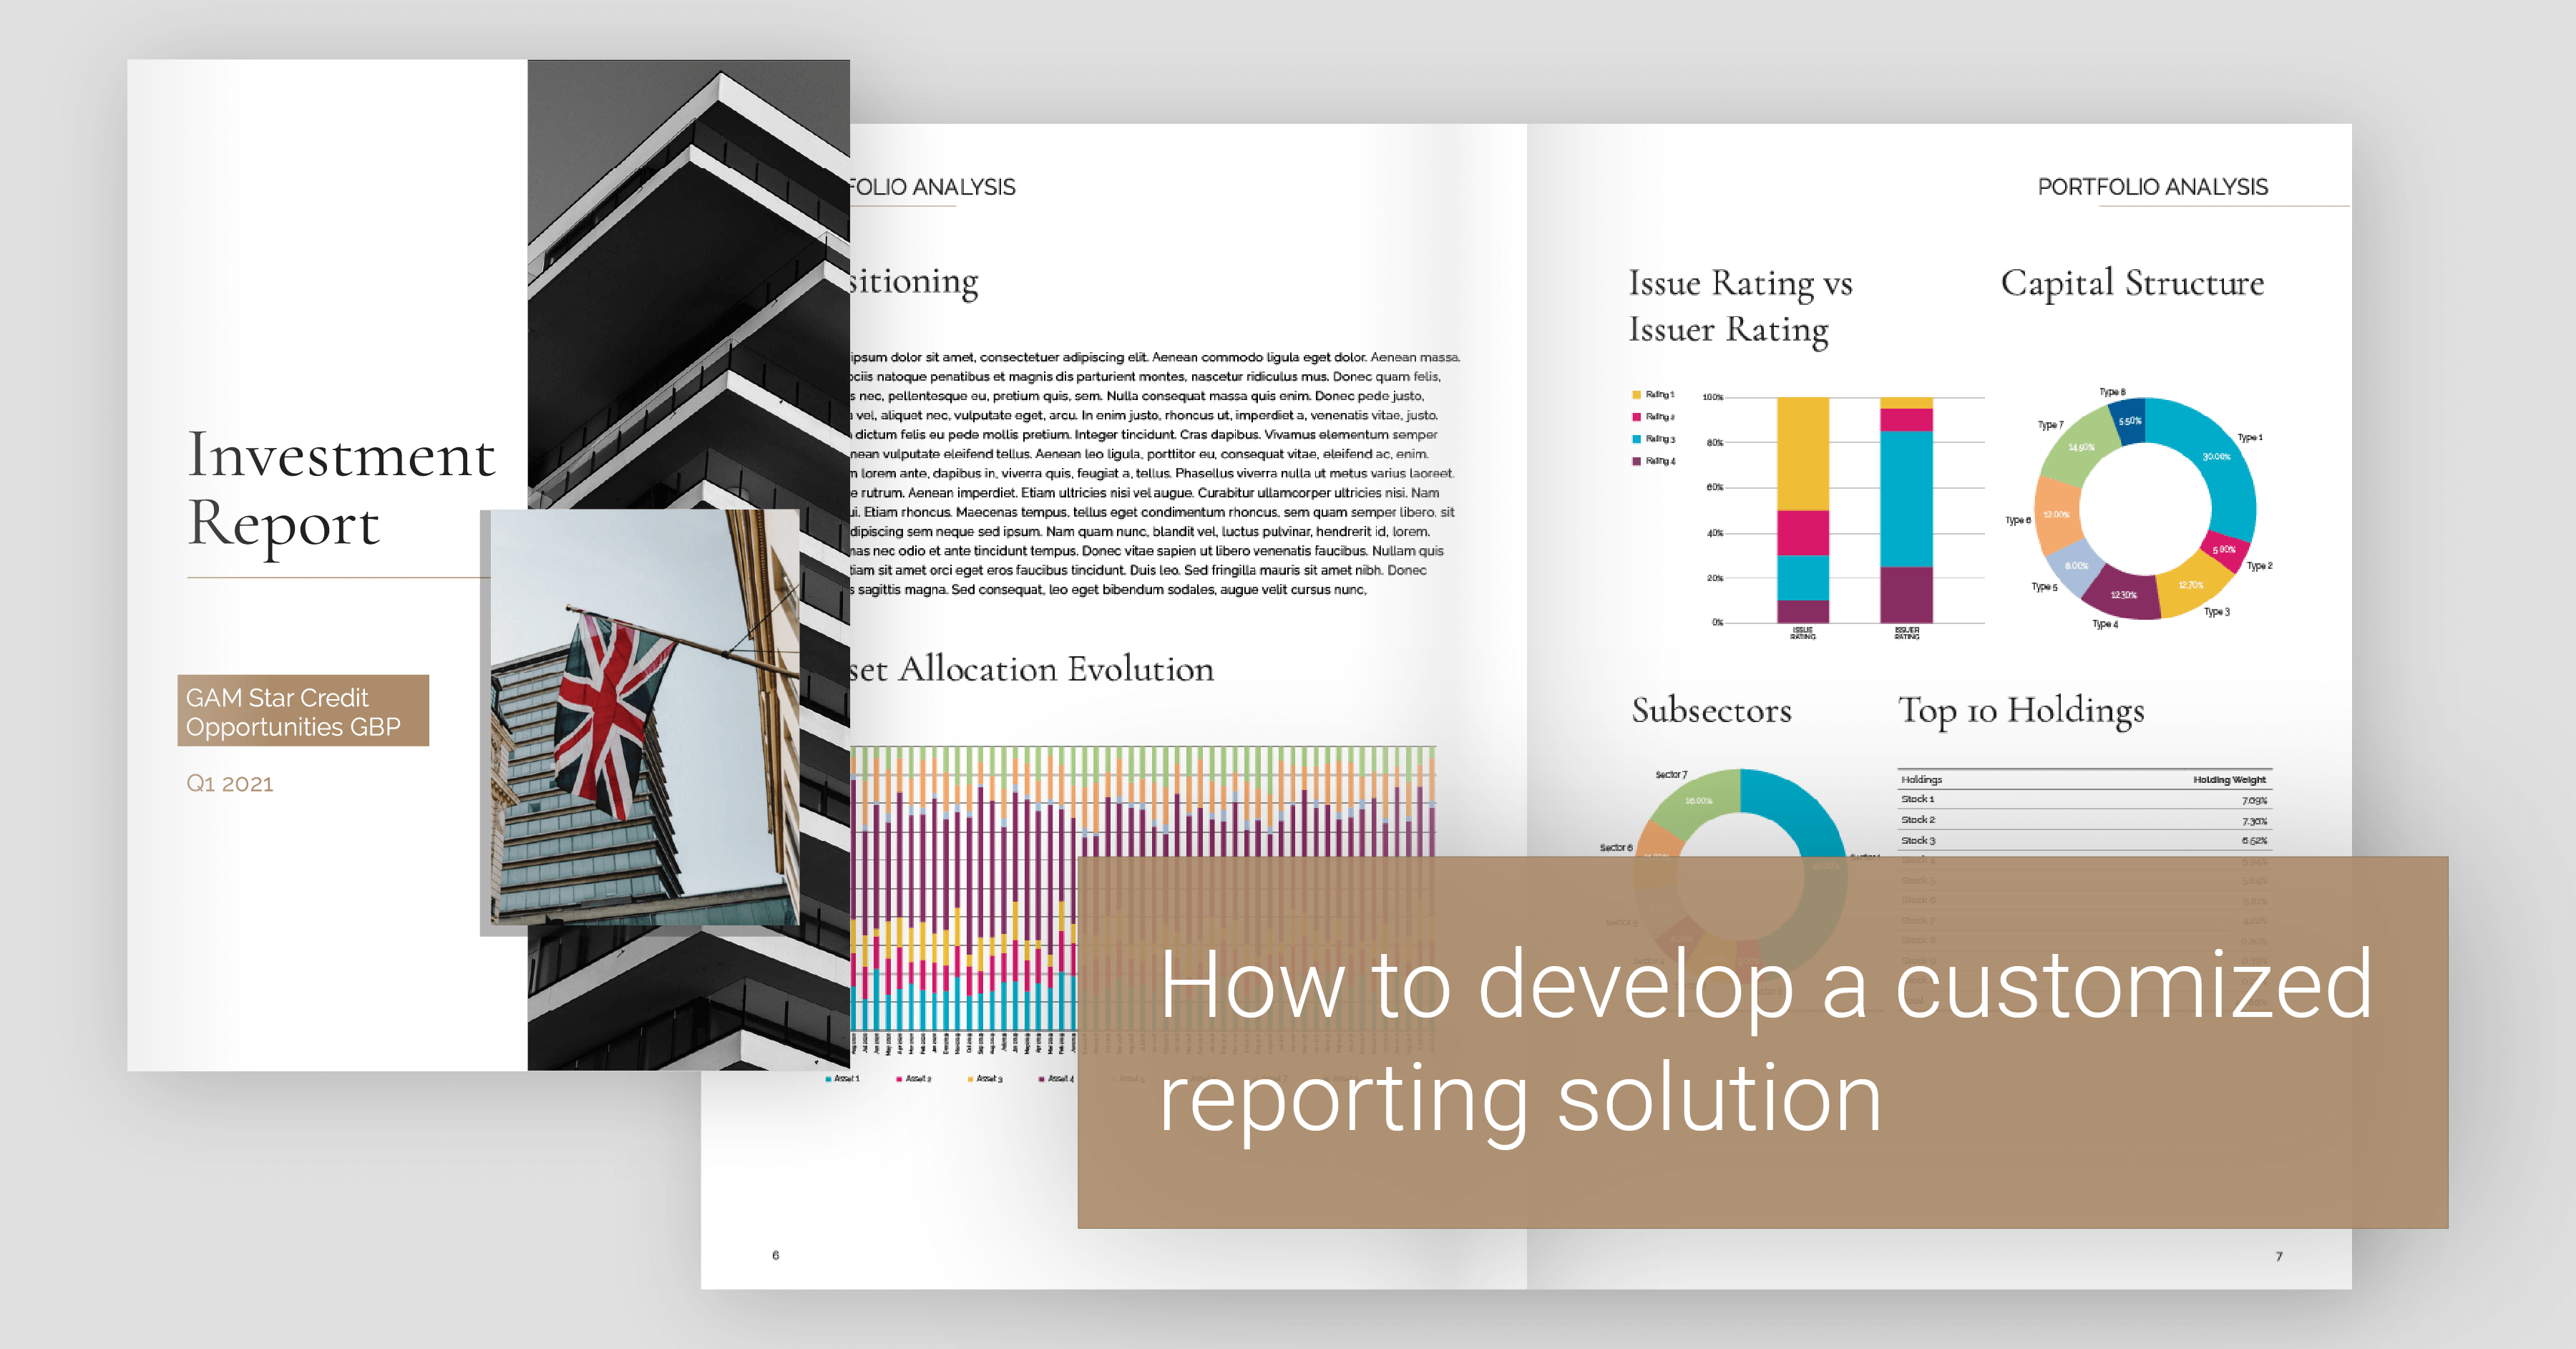
The Ultimate Guide to ESG Reporting
You may agree that environmental, social, and governance (ESG) reporting can feel complicated. You...